
Weekly
• Last Candlesticks pattern: Shooting doji
• Time of formation: 01 May 2017
• Trend bias: Sideways
Daily
• Last Candlesticks pattern: Bearish engulfing
• Time of formation: 5 May 2017
• Trend bias: Down
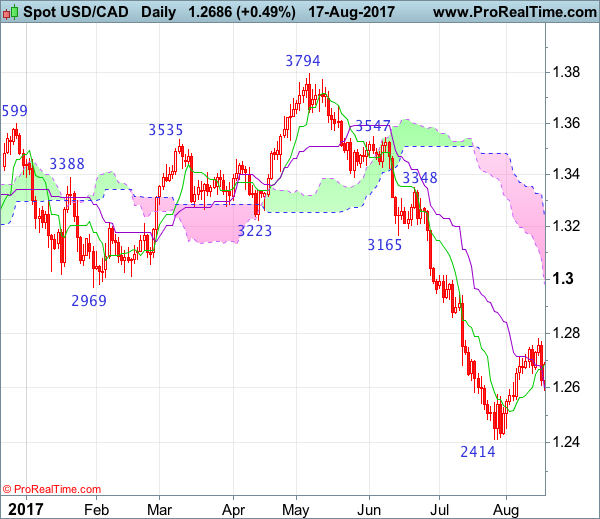
USD/CAD – 1.2631
The greenback met resistance at 1.2778 earlier this week and has retreated, suggesting consolidation with mild downside bias would be seen for weakness to 1.2550, then 1.2490-00, however, break of 1.2450-55 is needed to signal recent decline has resumed for retest of 1.2414. Looking ahead, once this support is penetrated, this would confirm resumption of early downtrend to 1.2350-60 and later towards 1.2300 but price should stay well above 1.2240-50, risk from there has increased for a rebound to take place later.
On the upside, expect recovery to be limited to the Tenkan-Sen (now at 1.2683) and 1.2700-10 should hold, bring another decline later. Above said resistance at 1.2778 would defer and risk a stronger rebound to 1.2810-20 but only a daily close above previous support at 1.2859 (now resistance) would suggest a temporary low is formed instead, bring a stronger rebound to 1.2900-05, however, still reckon upside would be limited to the lower Kumo (now at 1.2979) and price should falter below resistance at 1.3015, bring another selloff later this month.
Recommendation: Sell at 1.2690 for 1.2490 with stop above 1.2790.

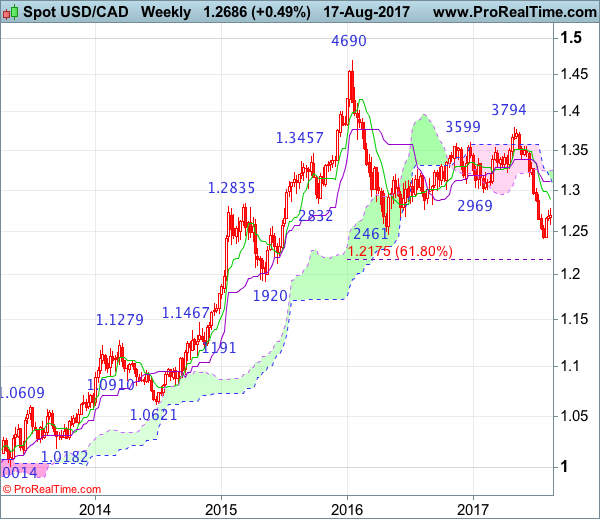
On the weekly chart, despite this week’s initial bounce to 1.2778, the subsequent retreat looks set to form a black candlestick with a long upper shadow this week, suggesting top is possibly formed there and consolidation below this level would be seen with downside bias for weakness to 1.2550, then 1.2500, however, break of 1.2450 is needed to signal the selloff from 1.4690 top has resumed for retest of 1.2414. Looking ahead, only break of said support at 1.2414 would provide confirmation and extend weakness to 1.2300-10 but oversold condition should prevent sharp fall below 1.2240-50 and price should stay above 1.2175 (61.8% Fibonacci retracement of 1.0621-1.4690).
On the upside, whilst initial recovery to 1.2700 cannot be ruled out, price should falter below said resistance at 1.2778 and bring another decline later. A break of said resistance would prolong consolidation above 1.2414 and risk a stronger corrective bounce to 1.2805-10 resistance, then test of previous support at 1.2859 (now resistance), above there would suggest a temporary low has been formed, bring a stronger rebound to 1.2900, then towards resistance at 1.2944 but upside should be limited to psychological level at 1.3000 and price should falter below the Kijun-Sen (now at 1.3104), bring another selloff in late Q3.


