
SPX short-term Elliott Wave analysis suggests that the decline to $2691.99 low ended intermediate wave (2) pullback. Above from there, the rally is taking the form of an impulse Elliott wave structure. The internal subdivision of each leg higher unfolded in 5 waves (i.e Minor wave 1, 3 and 5). On the other hand, Minor wave 2 & 4 are expected to take the form of any 3 wave corrective sequence i.e zigzag, double three, Flat etc.
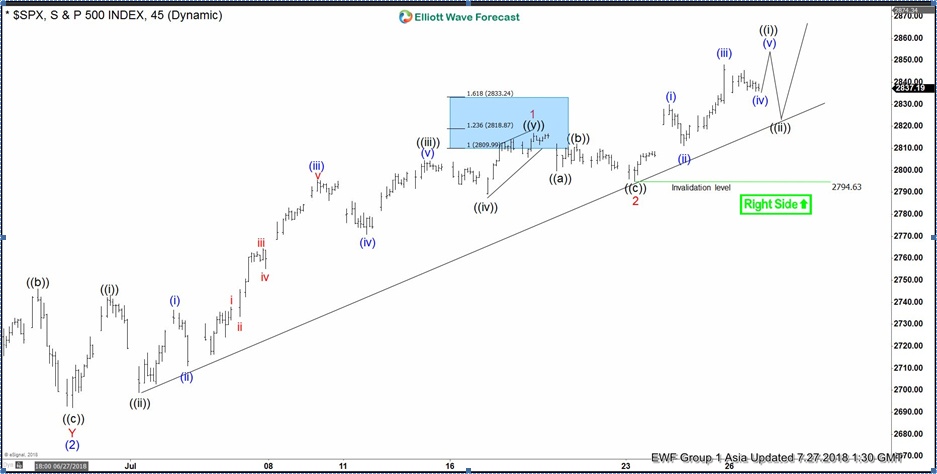
Up from $2691.99 low, the rally higher to $2743.26 high ended Minute wave ((i)) in 5 waves. The pullback in Minute wave ((ii)) ended at $2698.95, Minute wave ((iii)) ended in 5 waves at $2804.53 high. Then the pullback in Minute wave ((iv)) ended at $2789.24 low. And Minute wave ((v)) rally ended as ending diagonal at $2816.76 high. This rally also completed Minor wave 1. Down from there, the pullback to $2794.63 low ended Minor wave 2 as Elliott wave Zigzag correction.
Above from there, the index has managed to make a new high above $2816.76 peak confirming the next extension higher in Minor wave 3. Near-term, while dips remain above $2794.63 low and more importantly the pivot from $2691.99 low stays intact the index is expected to see more upside extension. We don’t like selling it and expect dips to remain supported in 3, 7 or 11 swings against $2794.63 low in the first degree.
SPX 1 Hour Elliott Wave Chart


