
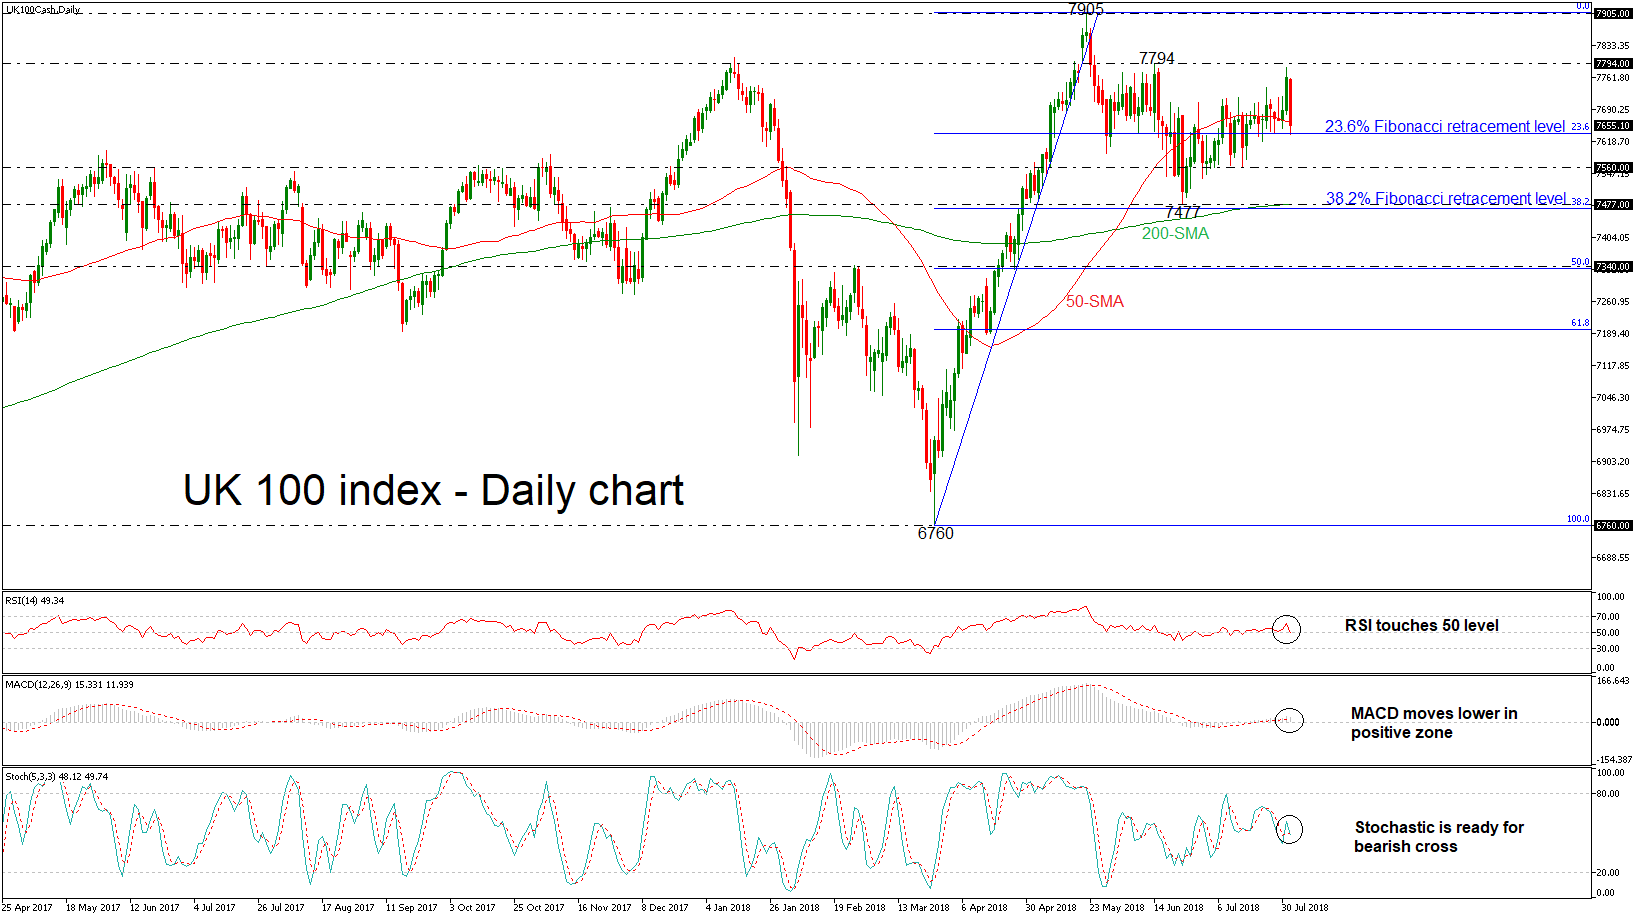
UK 100 index is on track to record a strong red day as it touched again the 23.6% Fibonacci retracement level of the upleg from 6760 to 7905, around 7635.57. This week, the price is on the backfoot and the technical indicators suggest that the market could ease a little bit in the short-term.
The RSI is currently increasing negative momentum towards its neutral threshold of 50, while the MACD is slowing down in positive territory, both hinting that the next move in prices could be on the downside rather than on the upside. Moreover, the stochastics indicate that further downside movement may be on cards as the % K line finally forms a bearish cross with the %D line.
Should the market extend losses and the index dives below the 23.6% Fibonacci, support could be met at the 7560 barrier, taken from the lows on mid-July. A significant leg below this area could send prices towards the 200-day simple moving average (SMA), which coincides with the 7477 support and stands near the 38.2% Fibonacci.
On the flip side, if the index bounces up, immediate resistance could be met at the 7794 level. A close above this level would endorse a bullish sentiment and push the price towards the 7905 hurdle, taken from the peak on May 22.
In the bigger picture, the pair is bullish as it still holds above the moving averages. In case it violates these lines, bears could take the upper hand.


