
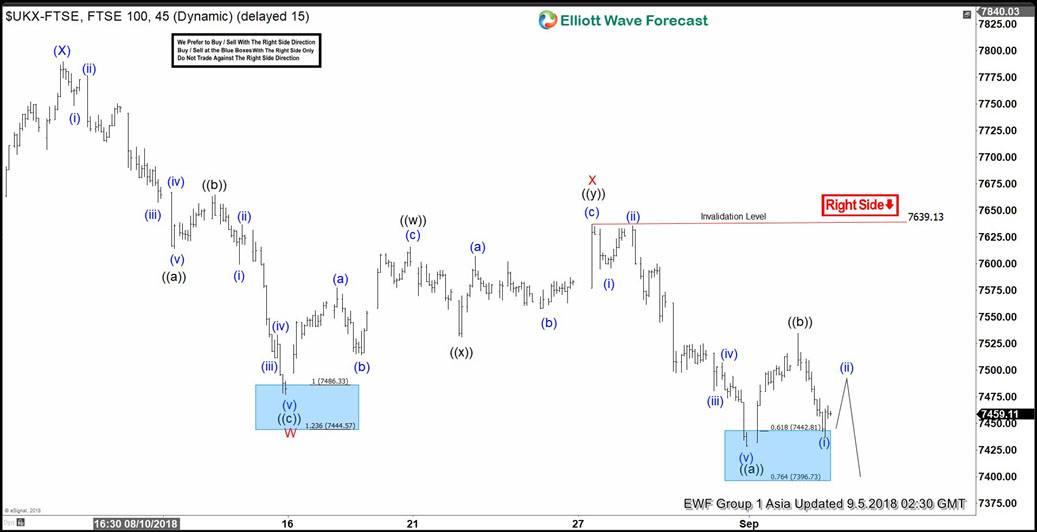
FTSE short-term Elliott Wave view suggests that the rally to 7790.17 high ended intermediate wave (X) bounce. Down from there, intermediate wave (Y) remains in progress with instrument showing a lower low sequence. The internals of that leg lower is taking place as double correction lower due to overlapping price action happening from 7790.17 high thus suggesting that the decline is unfolding in 3 waves corrective sequence.
Down from 7790.17 high, the initial move to 7477.05 low ended Minor wave W of (Y). The internals of that lesser degree decline unfolded as Zigzag structure where Minute wave ((a)) ended in 5 waves at 7614.48 low. Then the bounce to 7665.24 high ended Minute wave ((b)) bounce. And decline to 7477.05 low ended Minute wave ((c)) of W in another 5 waves structure. Up from there, the bounce higher to 7639.13 high ended Minor wave X of (Y). The internals of that bounce unfolded as double three structure where Minute wave ((w)) ended at 7616.15 high. Minute wave ((x)) ended at 7531.24 low and Minute wave ((y)) of X ended at 7639.13 high. Down from there, the index has made a new low confirming that Minor wave Y of (Y) has started and looking for extension lower towards 7323.99-7250.04, which is 100%-123.6% Fibonacci extension area of W-X. Near-term, while bounces stay below 7639.13 high expect index to extend lower. We don’t like selling it.
FTSE 1 Hour Elliott Wave Chart


