
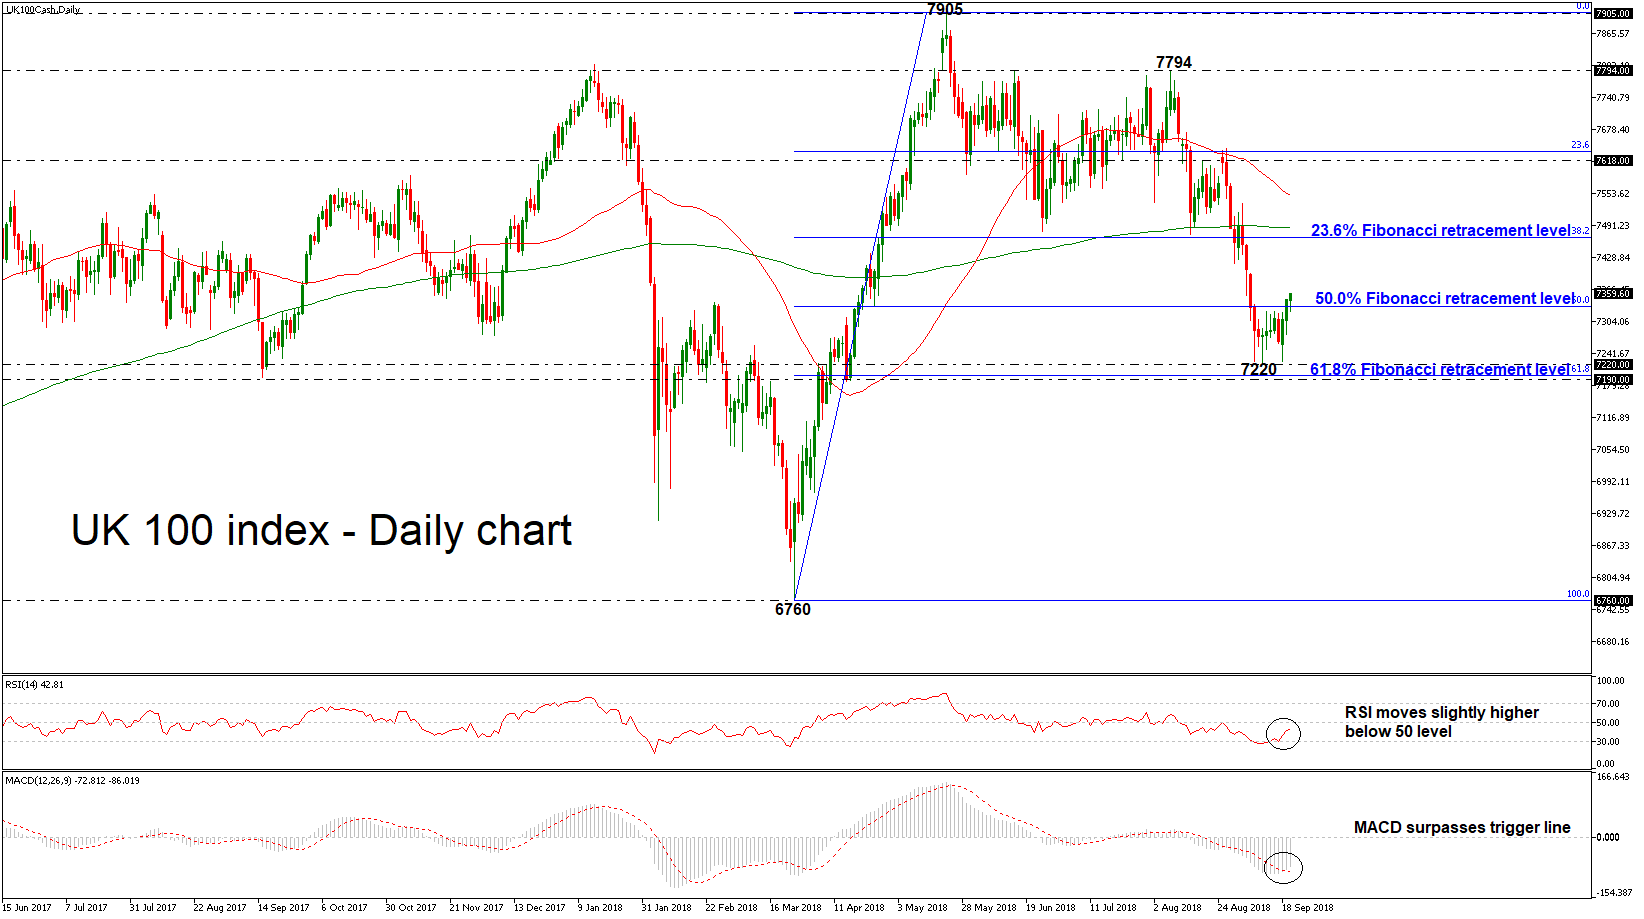
The UK 100 index jumped above the 50.0% Fibonacci retracement level of the upleg from 6760 to 7905, around 7333, during Wednesday’s session. Currently, the price remains slightly above its opening level, however, the technical indicators are standing in the negative zone. The RSI is edging slightly higher below 50 level and the MACD has jumped above its trigger line.
Should the market extend gains in the short-term, resistance could be met at the 38.2% Fibonacci retracement level of the upleg from 6760 to 7905, near 7468. A significant leg above this area and the 200-day simple moving average (SMA) could send prices towards the 50-day SMA at 7550 at the time of writing. Then, if the market breaks above this level, the next stop could be at the 7618 resistances.
Alternatively, if the price falls again below the 50.0% Fibonacci, immediate support could come from the 7220 barrier. Steeper decreases could drive the index south towards the 61.8% Fibonacci near the 7190 support.
In the medium-term, the outlook remains negative since prices hold below all the moving average lines. Unless there is a much stronger rebound, the 50- and the 200-day SMAs are not track for a bearish crossover in the next few sessions, which would underscore the bearish picture.


