
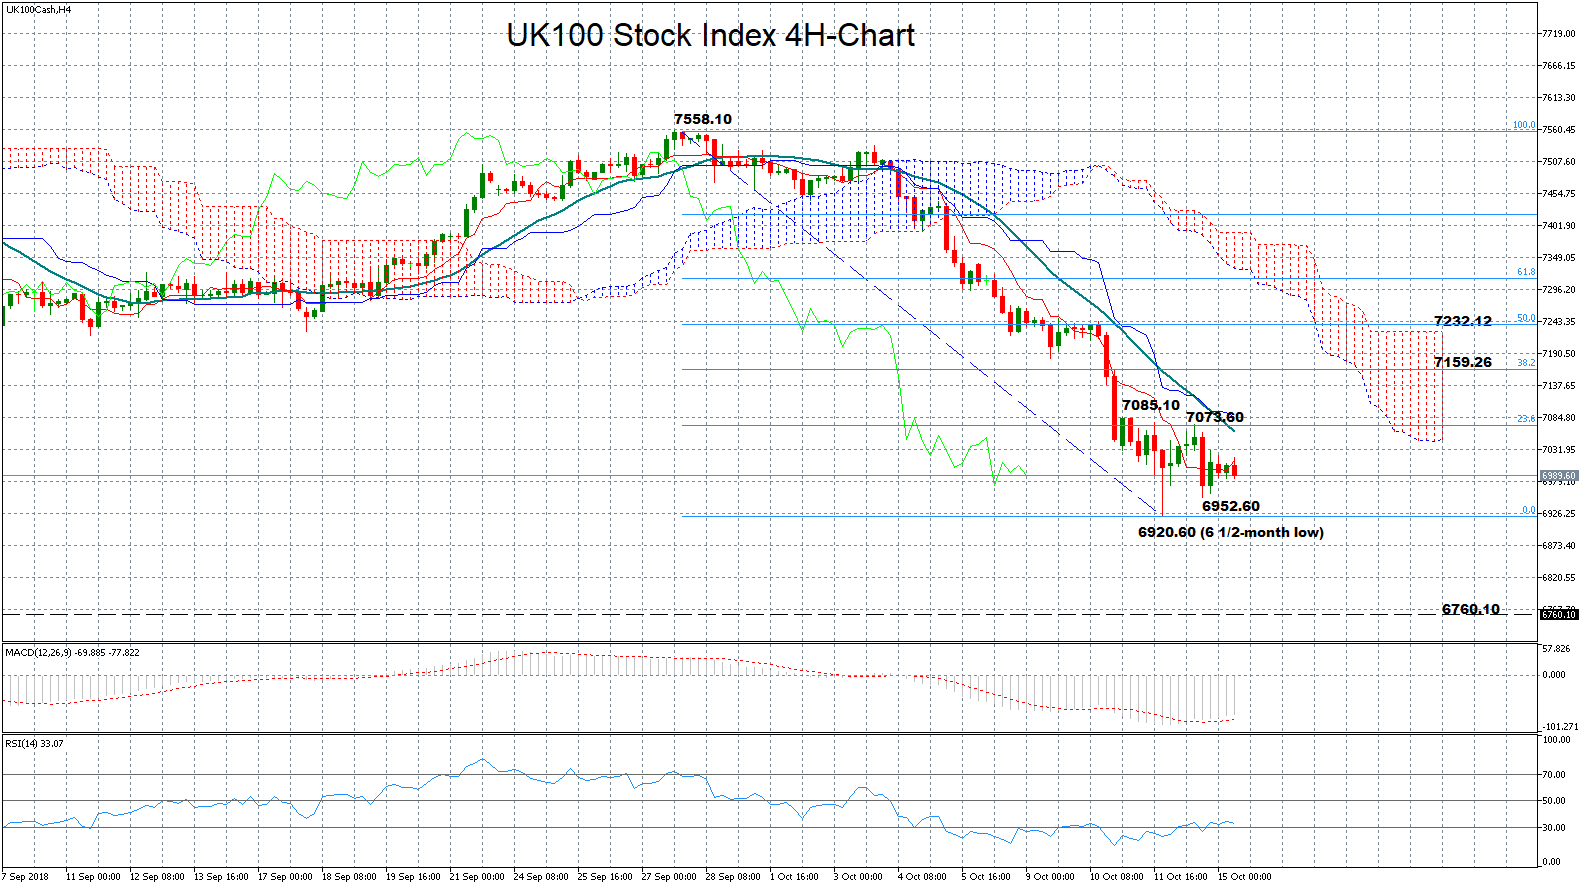
UK100 stock index (FTSE 100) has been under severe pressure over the past two weeks, tumbling to a 6 ½-month low of 6920.60 last Thursday. While the MACD and the RSI have somewhat improved in the four-hour chart, with the former gaining strength above its red signal line and the latter inching above its 30 oversold threshold, chances for downside corrections remain high as both indicators continue to hold well into the bearish territory; the MACD far below zero and the RSI well under 50.
If bears retake control, Friday’s low of 6952.60 could come first into view before attention turns down to the 6920.60 bottom. However, if negative momentum persists below that trough, all eyes will turn to the 14-month low of 6760.10 printed on March 25. In case that fails too, another barrier is expected to come at 6643.50, where the price posted a strong rebound in December 2016.
On the flip side, a reversal to the upside could see resistance between 7073.60 and 7085.10, taken from the highs printed the previous two sessions. That is slightly above the 23.6% Fibonacci of the donwleg from 7558.10 to 6920.60 which is also where the 20-period moving average currently stands. Any close above that zone could shift the focus towards the 38.2% Fibonacci of 7159.26. A bigger challenge, though, is expected to come around the 50% Fibonacci of 7232.12 as any beat at this level,which halted bearish corrections in September as well, could trigger further upside movements, bringing the neutral picture back into play.


