
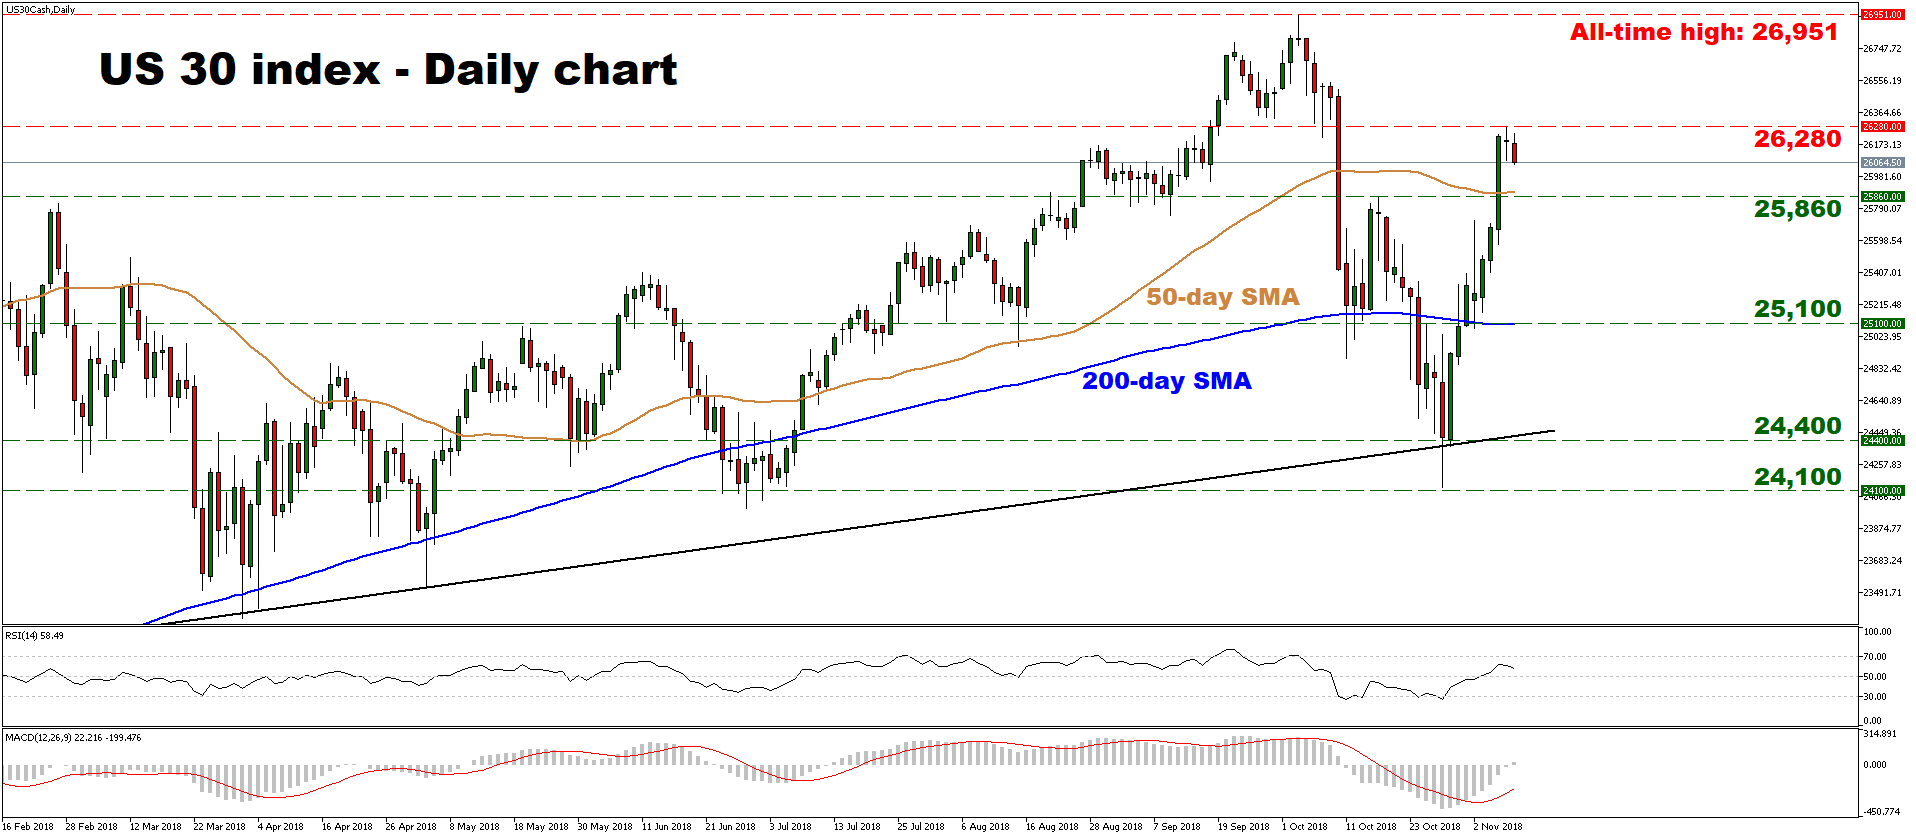
The US 30 index rebounded sharply in recent sessions, after finding support near a medium-term uptrend line drawn from the lows of February 6. The index has now crossed back above both the 50- and 200-day simple moving averages (SMA), which implies the short-term outlook is now back to positive.
Taking a look at short-term oscillators, the RSI looks to be headed lower for a test of its neutral-50 line, signaling that positive momentum is losing some steam. The MACD, on the other hand, rests safely above its red trigger line and has just crossed above zero, painting a predominantly bullish picture.
Further advances in the index could encounter immediate resistance near the November 8 high of 26,280. If the bulls pierce it, that may open the way for a test of 26,951, the all-time high recorded on October 3. Another upside break would bring the index into unchartered waters, with advances likely to stall near round figures that may hold psychological importance, such as 27,500 and 28,000.
On the other hand, another pullback could meet preliminary support around the crossroads of the 25,860 zone and the 50-day SMA, currently at 25,886. A bearish break would turn the picture to neutral and shift the focus to 25,100, where the 200-day SMA is also located at present. Even further downside extensions would turn the short-term outlook negative, setting the stage for a test of the October 30 trough at 24,400, and the aforementioned uptrend line.
To sum up, the short-term picture has realigned with the medium-term one and is back to positive, though a break back below the 50-day SMA would bring that into doubt.


