
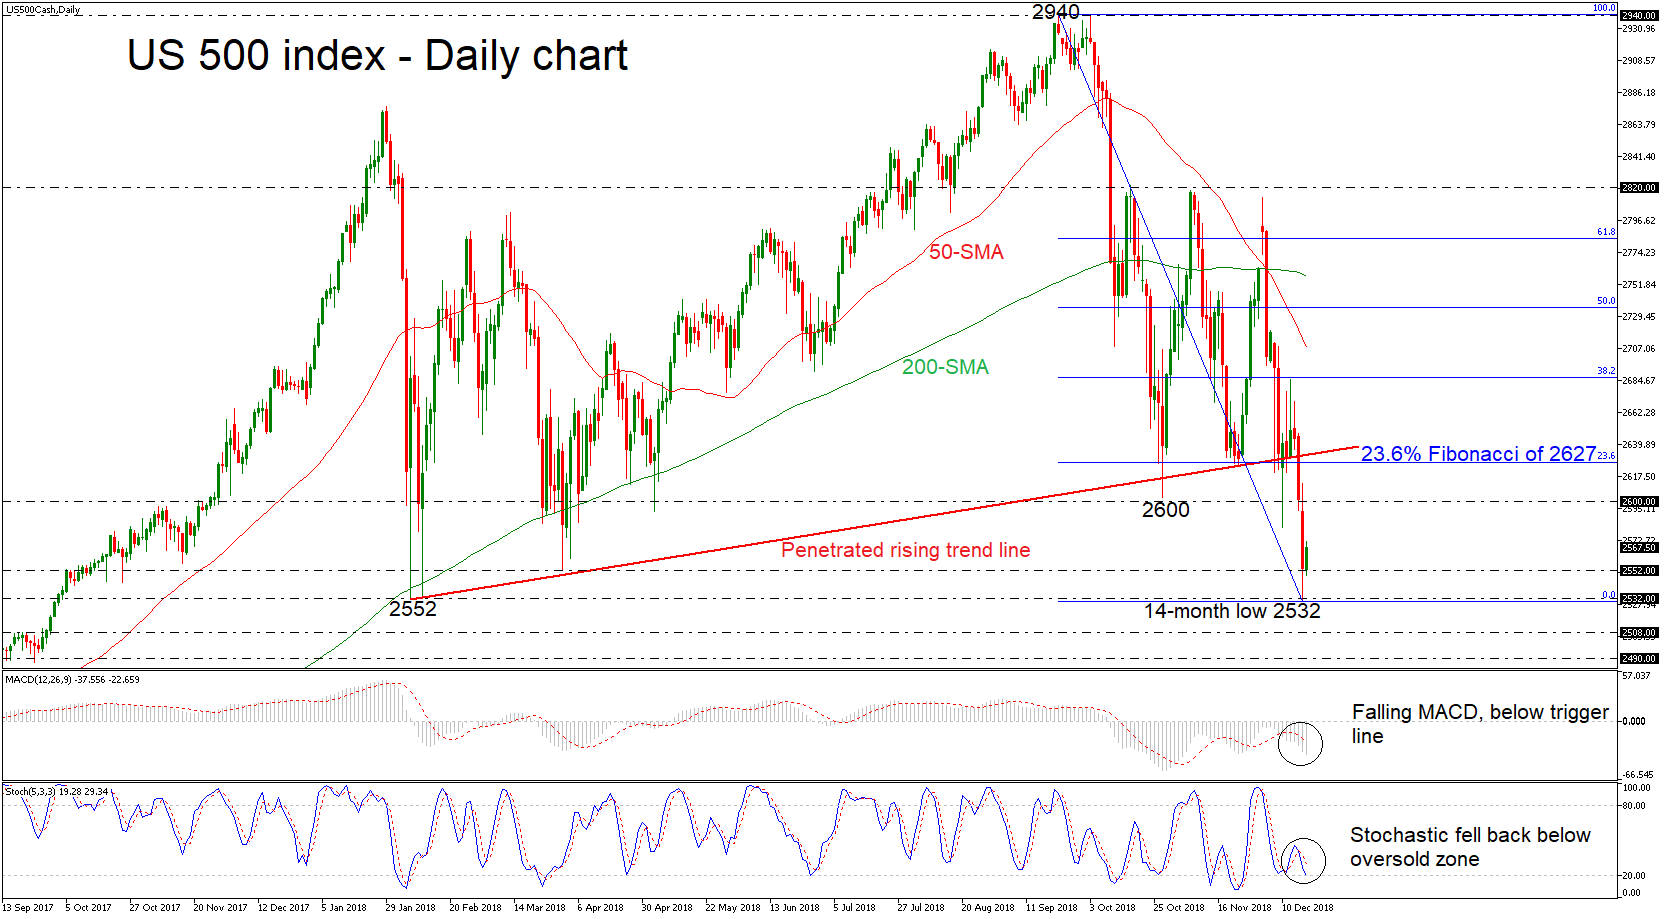
The US 500 index had a bearish start on Monday, with the price breaking a crucial support at 2600 to drop towards a 14-month low of 2529.80 and taking its year-to-date losses to 4.7%. The price has also increased distance below its negatively sloped moving average lines and the ascending trend line, which had been holding since February 6, indicating that the recent downtrend might hold for longer. However, the price is currently regaining some ground and hovers above the multi-month trough.
Momentum indicators are bearish as well as the stochastic oscillator has reversed lower again, while the MACD is strengthening its momentum below the trigger and zero lines.
Additional declines may drive the price towards the aforementioned 14-month bottom of 2532, before the 2580 level comes into view, taken from the highs on September 2017. Beneath the latter, the 2490 could be another level in focus, registered a bit later in September 2017 as well.
In case the index changes its short-term direction to the upside, the bulls will probably challenge the 2600 strong resistance barrier. A break higher, could last until the 23.6% Fibonacci retracement level of the dowleg from 2940 to 2532, around 2627.
Summarizing, in the medium-term, the recent price action switched the bullish outlook to a more negative one after the tumble below the 2600 hurdle and the rising trend line.

 Interventions?")


