
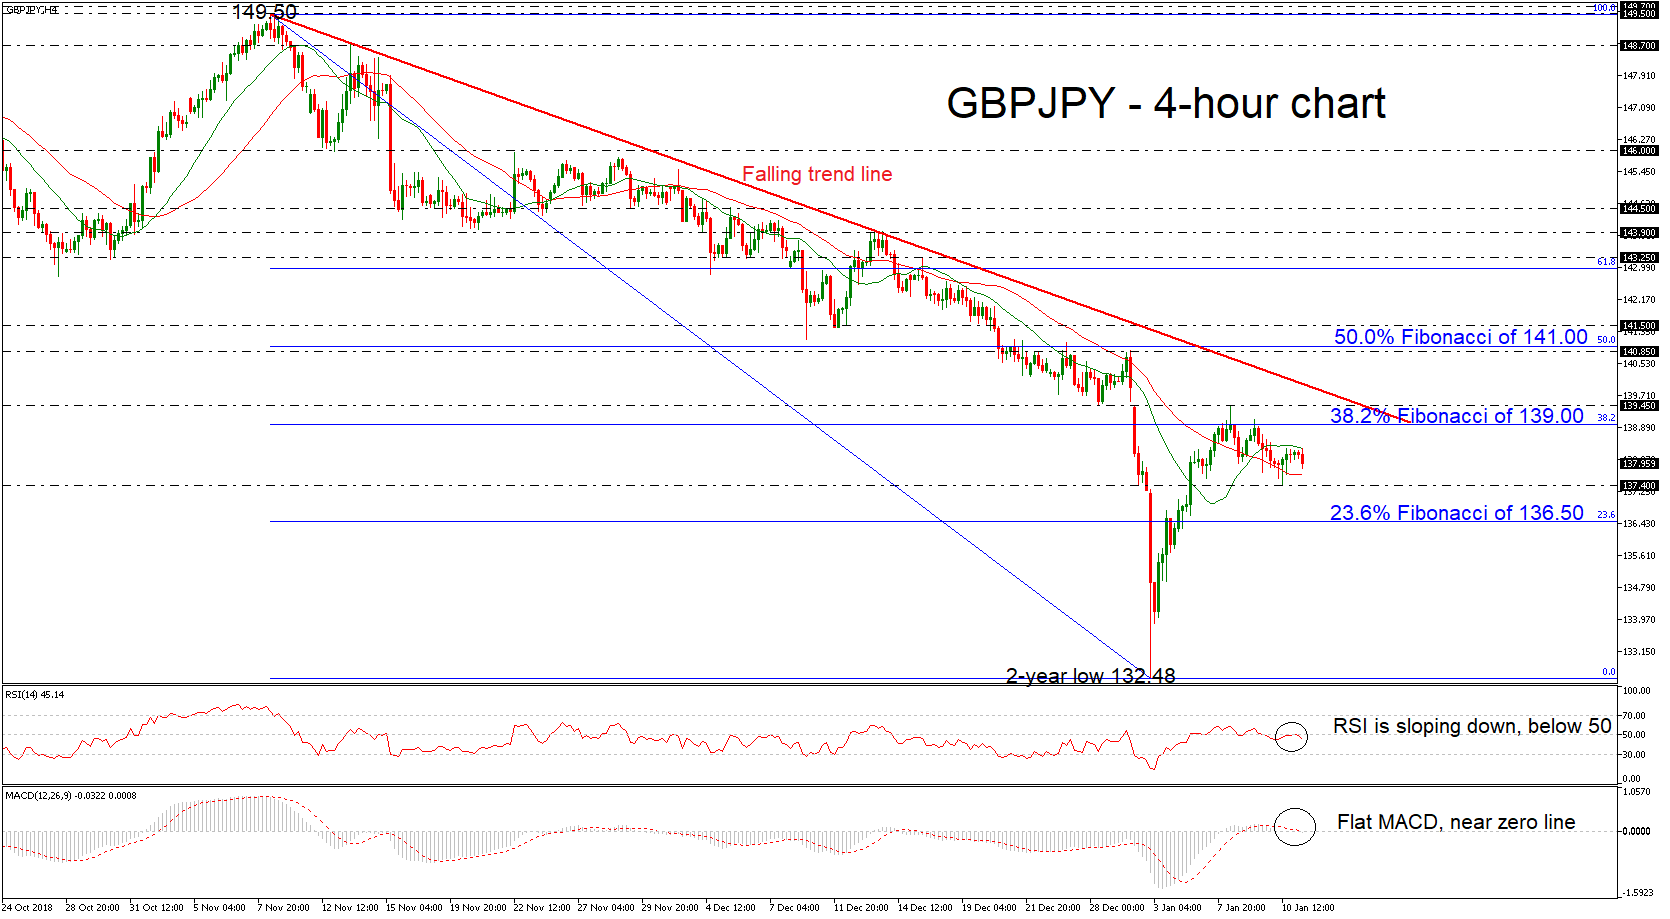
GBPJPY has been in a neutral mode after the price jump above the more than two-year low around 132.48. The technical indicators are turning lower as the price is losing momentum. The RSI indicator is sloping down, failing to surpass the 50 level, while the MACD oscillator is flattening near the zero line in the 4-hour chart. Also, currently, the price holds within the 20- and 40-simple moving averages (SMAs) lacking direction.
In case of bullish actions above the 38.2% Fibonacci retracement level of the downleg from 149.50 to 132.48, near 139.00, the price could find immediate resistance at the 139.45 barrier. Higher still, the pair could touch the 140.85 hurdle, which stands near the 50.0% Fibonacci level.
Alternatively, should the price break the floor around the 137.40 support, then the price could open the way towards the 23.6% Fibonacci of 136.50. If the latter proves a weak obstacle, then the next stop for investors to have in mind is the two-year low of 132.48.
Having a look at the bigger structure, GBPJPY has been developing in a descending movement since November 2018, creating lower lows and lower highs.


