
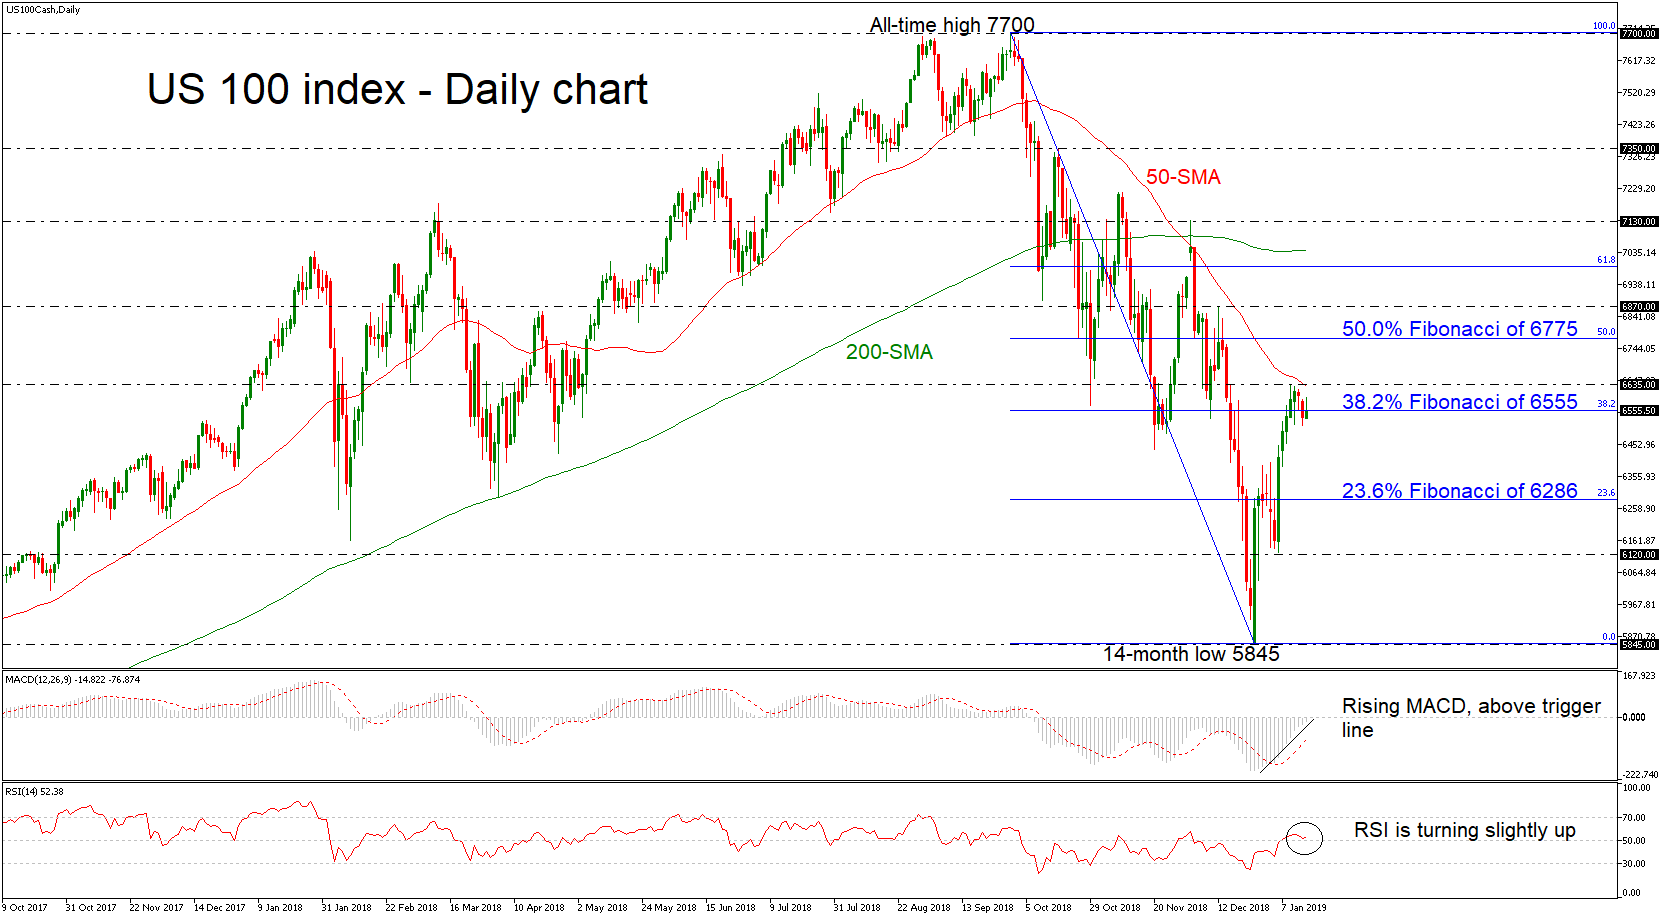
The US 100 stock index (NASDAQ 100) has reversed back to the upside, hitting the 50-day simple moving average (SMA). Currently, the price is hovering around the 38.2% Fibonacci retracement level of the downleg from 7700 to 5845, near 6555.
Momentum indicators in the daily chart though are currently supporting that positive momentum is likely to strengthen in the short-term. Specifically, the RSI is picking up speed above 50 and the MACD continues to distance itself above its red signal line.
Should the price decisively close above the roof of 6635, bulls could extend the bullish movement towards the 50.0% Fibonacci region of 6775. Further advances above this level, could then target the area around the 6870 resistance.
On the other side, a decline could meet the 23.6% Fibonacci mark of 6286, before moving even lower towards the next significant obstacle of 6120, taken from the latest lows. A break below this level could send the index until the 14-month low of 5845.
The recent bullish action turned the very short-term picture more positive, however, in the bigger view the index remains strongly bearish.


