
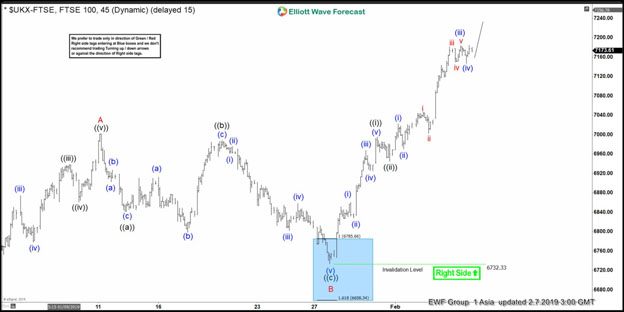
FTSE short-term Elliott wave view suggests that a rally from 12/27/2018 low (6536.53) is unfolding as a zigzag structure where initial rally to 7001.94 high ended wave A in 5 waves structure. Down from there, wave B unfolded as a Flat correction where wave ((a)) ended at 6841.74 low. Wave ((b)) bounce ended at 6987.93 high in lesser degree flat correction. Wave ((c)) ended in lesser degree 5 waves at 6732.33 low, which also completed wave B pullback. After reaching the blue box area at 6785.66-6658.34 100%-161.8% Fibonacci extension area of ((a))-((b)).
Up from there, wave C remain in progress as impulse structure where wave ((i)) ended at 6994.88 high. Wave ((ii)) pullback ended at 6945.05 low and ((iii)) remain in progress looking for more upside towards 7191.16-7473.95 100%-161.8% Fibonacci extension area of wave A-B to reach the extreme from 12/27/2018 low. Afterwards, index is expected to resume the downside or should do a 3 wave pullback at least. Near-term cycle from 12/27/2018 low is mature already with a minimum number of swings in place but as far as a pivot from 6732.33 low expect index to extend higher.
FTSE 1 Hour Elliott Wave Chart


