
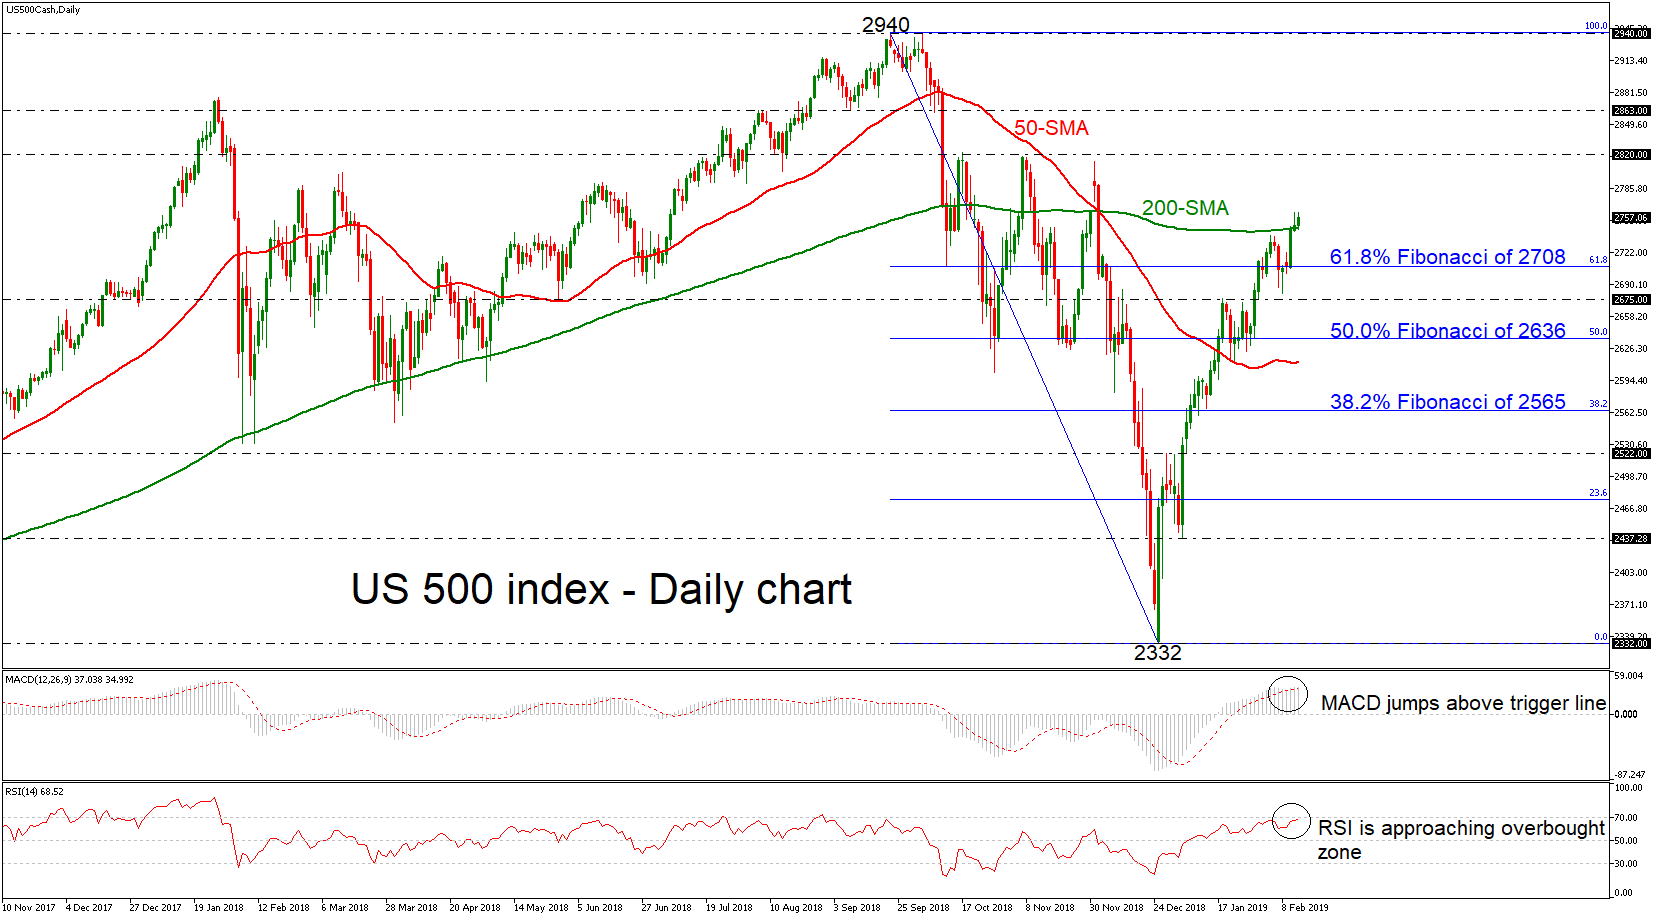
The US 500 stock index has had a bullish run above the strong obstacle of the 200-day simple moving average (SMA) and the 61.8% Fibonacci retracement level of the downleg from 2940 to 2332, indicating an upward tendency. Prices hit a two-month high of 2762 earlier today and the technical indicators are all pointing to further positive momentum in the short term.
The RSI indicator is heading upwards approaching the overbought territory, while the MACD oscillator posted a bullish cross with the red-trigger line in the positive area.
The next resistance to further gains would likely come from the 2820 barrier, taken from the high on November 2018. If there is a jump above this hurdle, resistance could be met around 2863, taken from the inside swing bottom on September 7.
On the other side, if the price loses momentum and retreats below the 200-SMA, it could challenge once again the 61.8% Fibonacci of 2708. Dropping below this area could take prices towards the 2675 support before hitting the 50.0% Fibonacci of 2636.
In the medium-term, the index is trying to switch the neutral mode to a more bullish one after the significant rebound on the 2332 region.


