
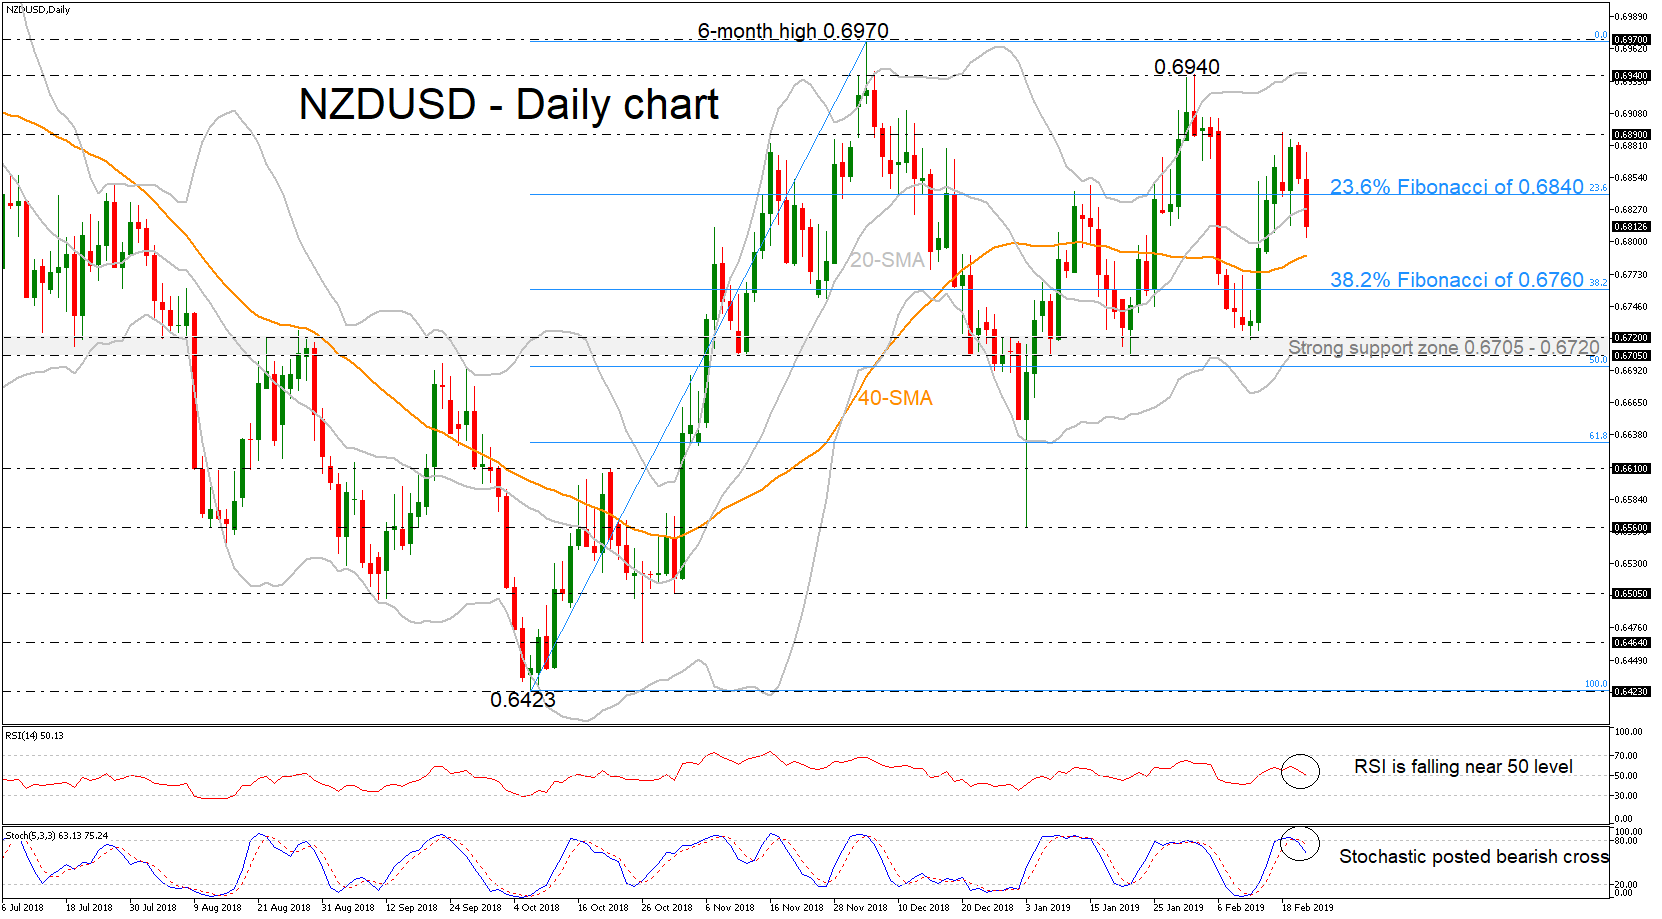
NZDUSD has aggressively reversed back to the downside, dropping below the 23.6% Fibonacci retracement level of the upleg from 0.6423 to 0.6970, around 0.6840, and the mid-level of the Bollinger Band currently at 0.6830.
Momentum indicators are pointing to a negative bias in the short term with the RSI trying to fall below the 50 level and the stochastic oscillator is declining from the overbought area. The stochastics have posted a bearish crossover within the %K and %D lines, suggesting further losses in the market.
More downside pressures would find immediate support level near the 40-day simple moving average (SMA), which holds near 0.6790, before moving even lower until the 38.2% Fibonacci mark of 0.6760. If there is a successful break below this zone, the 0.6705 – 0.6720 support region, could be the next levels for traders to look for, which encapsulates the lower Bollinger Band as well.
Alternatively, in case of an upward move, immediate resistance could come from the 23.6% Fibonacci of 0.6840 and the 0.6890 peak, taken from the latest highs. Should this prove a weak obstacle, the buying interest could pick up speed until the 0.6940 hurdle, which coincides with the upper Bollinger Band in the near term.
In the medium-term picture, the bounce off the six-month high of 0.6970 turned the outlook to a more negative to neutral again. Chances for another bullish move would rise in case of climb above the aforementioned peak.

 Interventions?")


