
US 500 index showed little change after opening the week with a small positive gap above its 50-day simple moving average (SMA).
The distance between the MACD and its red signal line and the bullish momentum in the indicator suggests there is some room for improvement, but in the very short-term a consolidation phase may follow if the fast RSI continues to grind sideways.
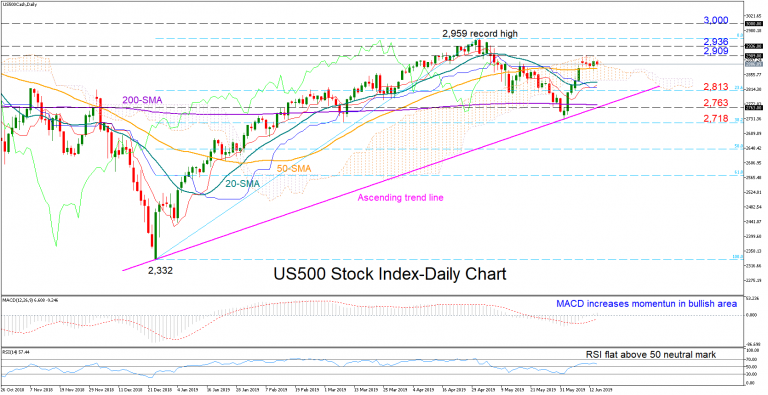
A closing price above the 2,909-2,936 area and therefore on top of the Ichimoku cloud could trigger another bullish game more likely towards the all-time high of 2,959. Higher, the market would enter uncharted area, turning the spotlight to the 3,000 psychological mark.
Should the market correct to the downside, the 23.6% Fibonacci ratio of 2,813 of the upleg from 2,332 to 2,959, could provide nearby support, while lower, a more interesting battle could start near the ascending line drawn from the 2,332 bottom – around 2,763. Any decline below the line could feed speculation that a downward pattern may be on the way, with confirmation awaited around the 38.2% Fibonacci of 2,718.
Meanwhile, in the three-month time frame (medium-term), the outlook remains neutral as long as the price hovers within the 2,728-2,599 area.


