
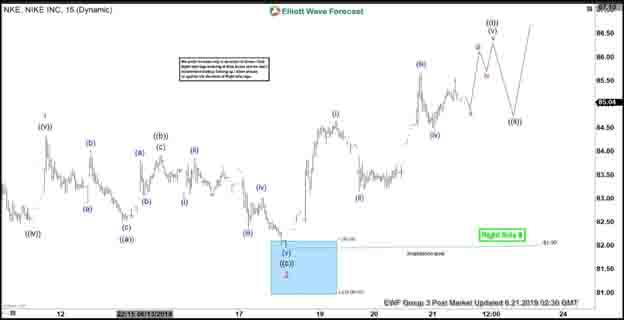
Nike (ticker: NKE) shows a higher high sequence from June 3 low ($76.91) favoring more upside. Rally from June 3 low to June 11 high (84.33) unfolded as an impulse Elliott Wave structure and ended wave 1. Pullback to 81.99 ended wave 2. Internal of wave 2 unfolded as a Flat Elliott Wave structure. Wave ((a)) of 2 ended at 82.52, wave ((b)) of 2 ended at 83.92, and wave ((c)) of 2 ended at 81.99.
Nike has since broken above wave 1 at 84.33, suggesting the next leg higher has started. Wave 3 is currently in progress as an impulse structure. Up from 81.99, wave (i) ended at 84.64, and pullback to 83.14 ended wave (ii). Wave (iii) ended at 85.67 and wave (iv) ended at 84.42. Expect Nike to do another leg higher to end wave (v) which should also end wave ((i)) of 3. The stock should then pullback in wave ((ii)) of 3 to correct cycle from June 18 low before the rally resumes. We don’t like selling the stock and expect buyers to appear as pullback stays above 81.99 in 3, 7, or 11 swing.
Nike (NKE) 1 Hour Elliott Wave Chart


 Interventions?")


