
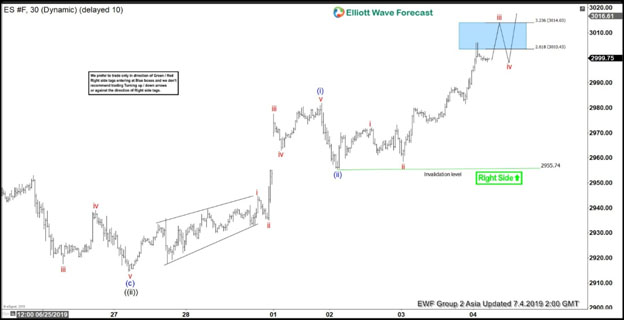
Elliott wave view in S&P 500 Futures (ES_F) shows a bullish sequence from December 26, 2018 low favoring further upside. In the short term chart below, the pullback to June 27 low (2914.5) ended wave ((ii)). Wave ((iii)) remains in progress as an impulse Elliott Wave structure looking for more upside. Up from June 27 low, wave (i ) ended at 2981.75 with subdivision as another impulse in lesser degree. Wave i of (i) ended at 2944.75 and wave ii of (i) pullback ended at 2935. Index then resumes higher in wave iii of (i) towards 2977.5, wave iv of (i) ended at 2963 and wave v of (i) ended at 2981.75.
Wave (ii) pullback ended at 2955.5. Wave (iii) is in progress and short term, while dips stay above 2955.74, expect the Index to extend higher. We don’t like selling the Index. As far as pullback stays above July 2 low (2955.74), expect Index to continue higher. If pivot at 2955.74 gives up, the Index is still expected to remain supported against June 4 low (2728.75). The Index has potential target to the upside towards 100% extension from December 26, 2018 low which comes at 3377 – 3529 area.
ES_F 1 Hour Elliott Wave Chart


