
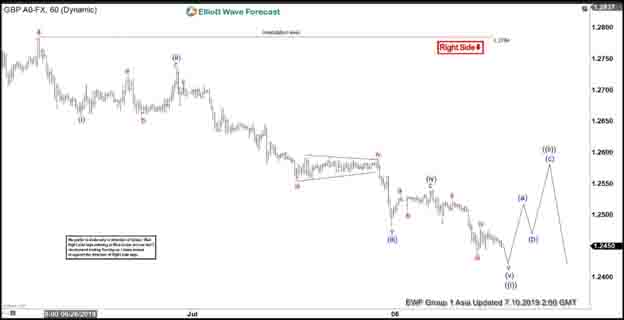
Elliott Wave View suggests the move lower from March 13, 2019 high (1.3381) is unfolding as an impulse Elliott Wave structure. In the short term chart below, the bounce to 1.2784 ended wave 4 as part of the impulse move from March 13 high. Pair is currently within wave 5 and the internal also unfolds as a 5 waves impulse in lesser degree. Down from 1.2784, wave (i) ended at 1.2661 and wave (ii) ended at 1.2735. Pair then resumes lower in wave (iii) towards 1.248, and wave (iv) bounce ended at 1.254. Expect pair to end wave (v) of ((i)) soon, then pair should at least bounce in 3 waves within wave ((ii)) before the decline resumes.
The rally in wave ((ii)) should unfold in 3, 7, or 11 swing to correct cycle from June 25 high. As far as pivot at 1.278 high stays intact in the bounce, pair can see further downside. We don’t like buying the pair. The alternate view suggests that pair can end the entire wave 5 with one more leg lower instead of ending only wave ((i)) of 5. In this alternate case, pair should rally in a larger degree in 3 waves at least to correct the bigger 5 waves move starting from March 13, 2019 high.
GBPUSD 1 Hour Elliott Wave Chart

 Interventions?")


