
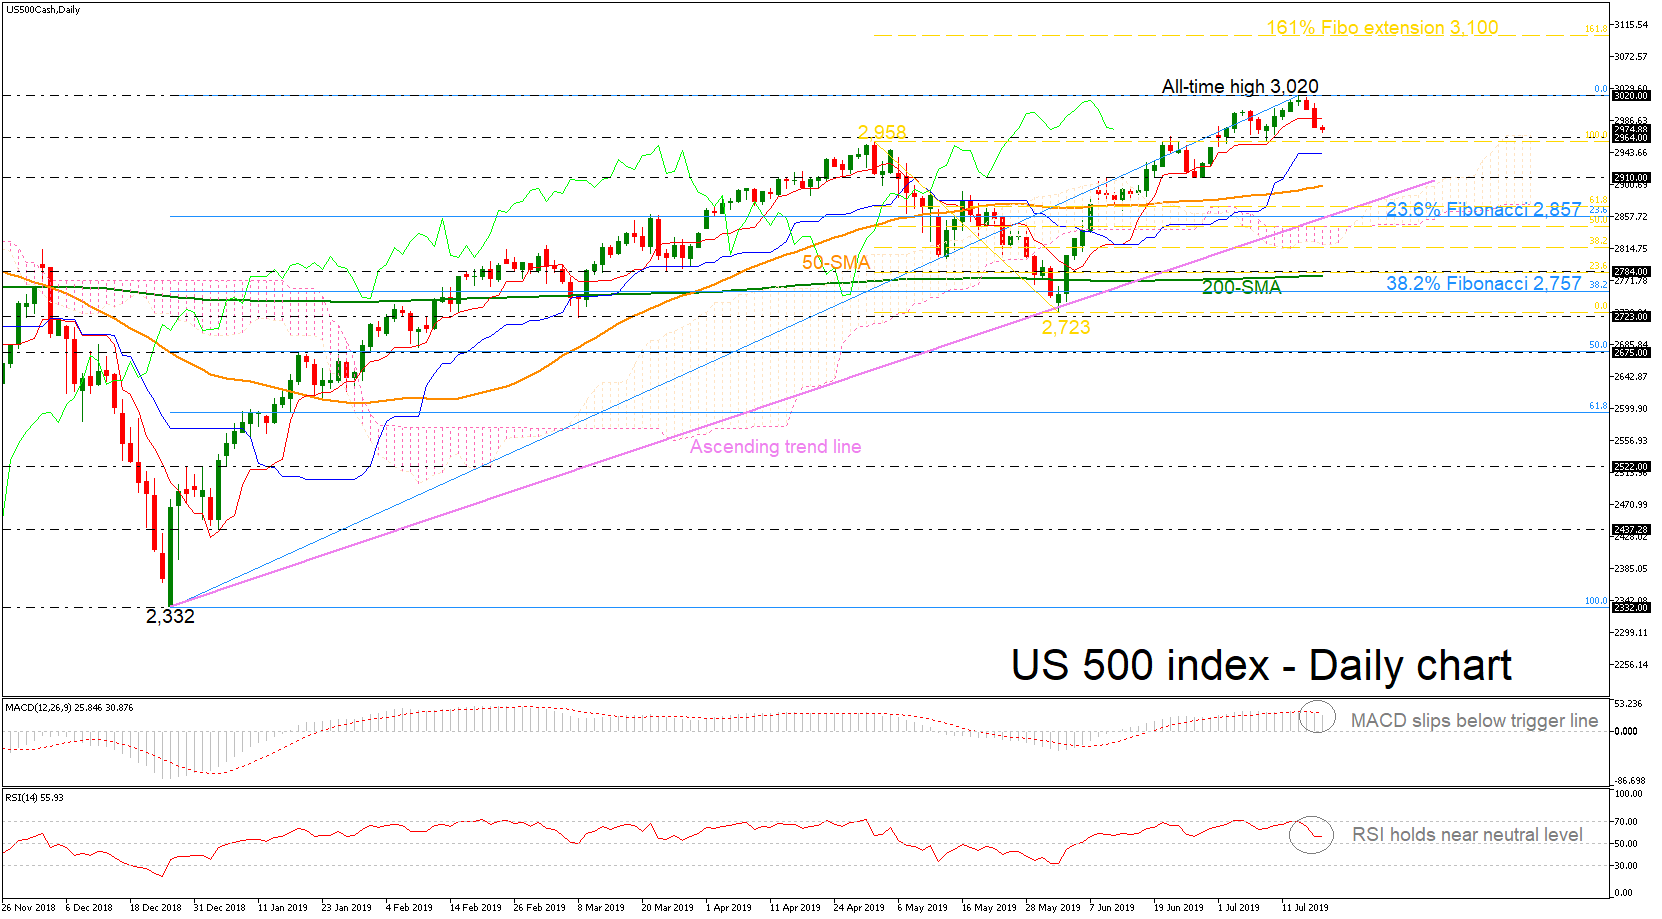
The US 500 stock index has pulled back somewhat after touching an all-time high of 3,020 in the prior week, reversing back below the red Tenkan-sen line. Momentum indicators now suggest that the market sentiment might get worse before getting better as the RSI is approaching the neutral area again and the MACD dived below its trigger line in the daily timeframe.
Should bearish dynamics dominate in the very short-term, the market might revisit the 2,964 support and move even lower towards the 2,910 area. Marginally below this zone the 40-day simple moving average (SMA) currently at 2,900 could come in focus. A test of the long-term rising trend line could be another strong support near the 23.6% Fibonacci retracement level of the upleg from 2,332 to 3,020 near 2,857.
Alternatively, if the price manages to rebound above the uptrend line, it could test the record high again (3,020). More aggressive advances could lead the index until the 161.8% Fibonacci extension level of the downfall from 2,958 to 2,723 at 3,100.
Summarizing, the US 500 index has been in a bullish rally since December 2018, however, any decline below the 23.6% Fibo could feed speculation that a downward pattern may be on the way, with confirmation awaited around the 38.2% Fibonacci of 2,745.


