
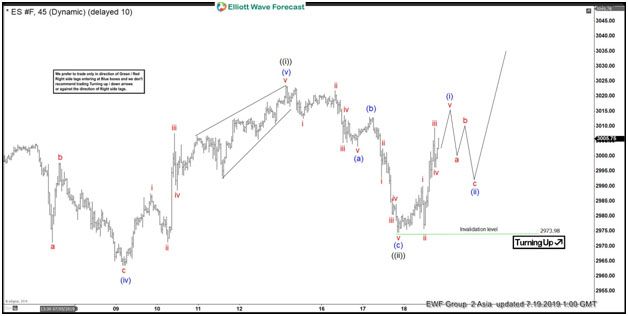
Elliott wave view in S&P 500 Futures (ES_F) shows a bullish sequence from December 26, 2018 low favoring the further upside. In the short-term chart below, the index ended the 5 waves rally from 6/13/2019 low within wave ((i)) at $3023.50 high. Down from there, the index corrected the rally from 6/13/2019 low in wave ((ii)) & made a 3 swings pullback. The pullback from the peak unfolded as Elliott wave zigzag structure where wave (a) ended the first leg in lesser degree 5 waves at $3003.25 low.
Up from there, wave (b) bounce ended at $3013 high. Wave (c) ended at $2974.76 low with another lesser degree 5 waves. Therefore completed the correction in wave ((ii)) pullback. However, a break above $3023.50 high seen at 7/15/2019 peak will remain to be seen to validate this bullish view & to avoid double correction lower from the peak. Above from $2974.76 low, the index is looking to extend higher 1 more push higher to become 5 waves impulse rally in wave (i). Afterwards, the index is expected to see a shorter-term pullback against $2974.76 low in 3, 7 or 11 swings within wave (ii) before more upside can be seen. We don’t like selling the index and a potential target from December 26, 2018 low will remain at 3377 – 3529 area to the upside.
ES_F 1 Hour Elliott Wave Chart


