
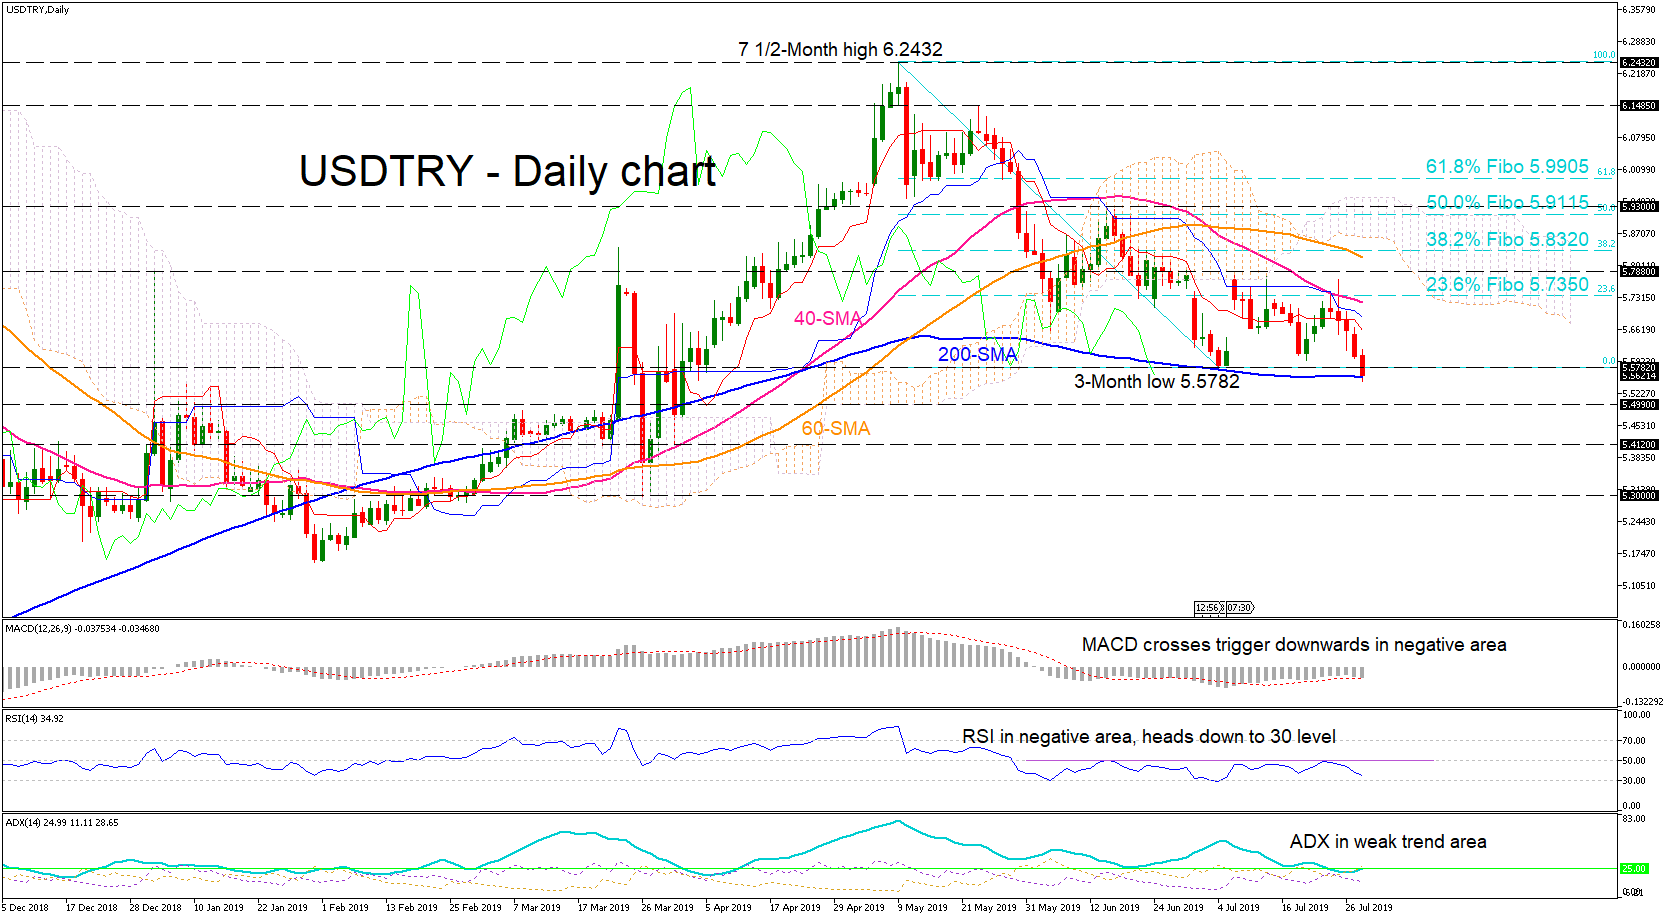
The USDTRY recorded multiple red days after a move off the 5.7350 resistance, which was the 23.6% Fibonacci retracement of the down leg from a seven-and-a-half-month high of 6.2432 to a low of 5.5782. The selling interest brought the price to sit on the 200-day simple moving average (SMA) slightly past the three-month low of 5.5782 formed on July 4.
The Tenkan-sen and Kinjun-sen are pointing down, agreeing with the negative directional momentum suggested from the MACD and the RSI, as the MACD has crossed its trigger down, and the RSI creeps towards the oversold area. The ADX is currently showing a short-term weak trend.
A continued selling interest may push the pair past the 200-day SMA to meet a support area of 5.5000 – 5.4990, before opening a test of the low of 5.4120 from April 1. A fiercer sell-off could bring attention to the 5.3000 hurdle support from March 27.
If the 200-day SMA holds, an upside move could initially see resistance come from the averages of the Ichimoku indicator around 5.6600 – 5.6900 before the 40-SMA near 5.7350, which is the 23.6% Fibo. If buyers insist, next resistance could occur at 5.7880, while slightly higher a barrier of 5.8320, which is the 38.2% Fibo, coupled with the 60-day SMA could seem to be a tougher opponent.
Overall, the short-term looks to be bearish for now, and a breach below the 200-SMA would confirm that perspective.


