
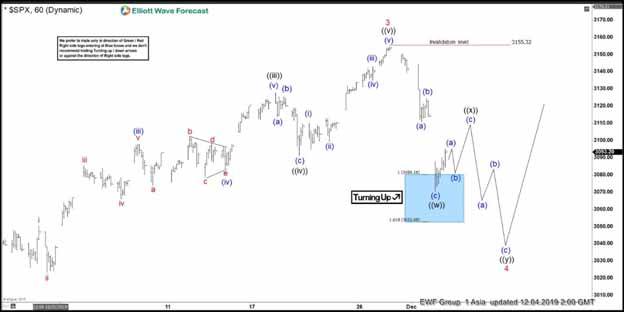
Short term Elliott Wave view on SP 500 (SPX) suggests the rally from August 6, 2019 low is unfolding as a 5 waves impulsive Elliott Wave structure. On the chart below, we can see wave 3 of the impulsive move ended at 3155.32. Wave 4 pullback is currently in progress as a double zigzag before the rally resumes. Down from 3155.32, wave (a) ended at 3110.78 and wave (b) rally ended at 3124.53. Index then resumes lower in wave (c) and ended the zigzag move at 3070.33. This zigzag move also completes wave ((w)) in higher degree.
Index should now bounce in wave ((x)) to correct the decline from November 28 high before turning lower again. As far as pivot at 3155.32 stays intact, Index has scope to extend lower to continue correcting in wave 4 as a double zigzag. Wave 4 typically ends around 23.6 – 38.2 Fibonacci retracement of wave 3. This area comes at 3040 – 3084. The Index has already reached 23.6 Fibonacci retracement at 3084, so technically it has met the minimum requirement to end wave 4. However, we are still calling a double zigzag in wave 4 as far as rally fails below 3155.32. If pivot at 3155.32 gives up, it suggests the Index has ended wave 4 as a zigzag, and Index then would be already in wave 5 higher.
SPX 1 Hour Elliott Wave Chart


