
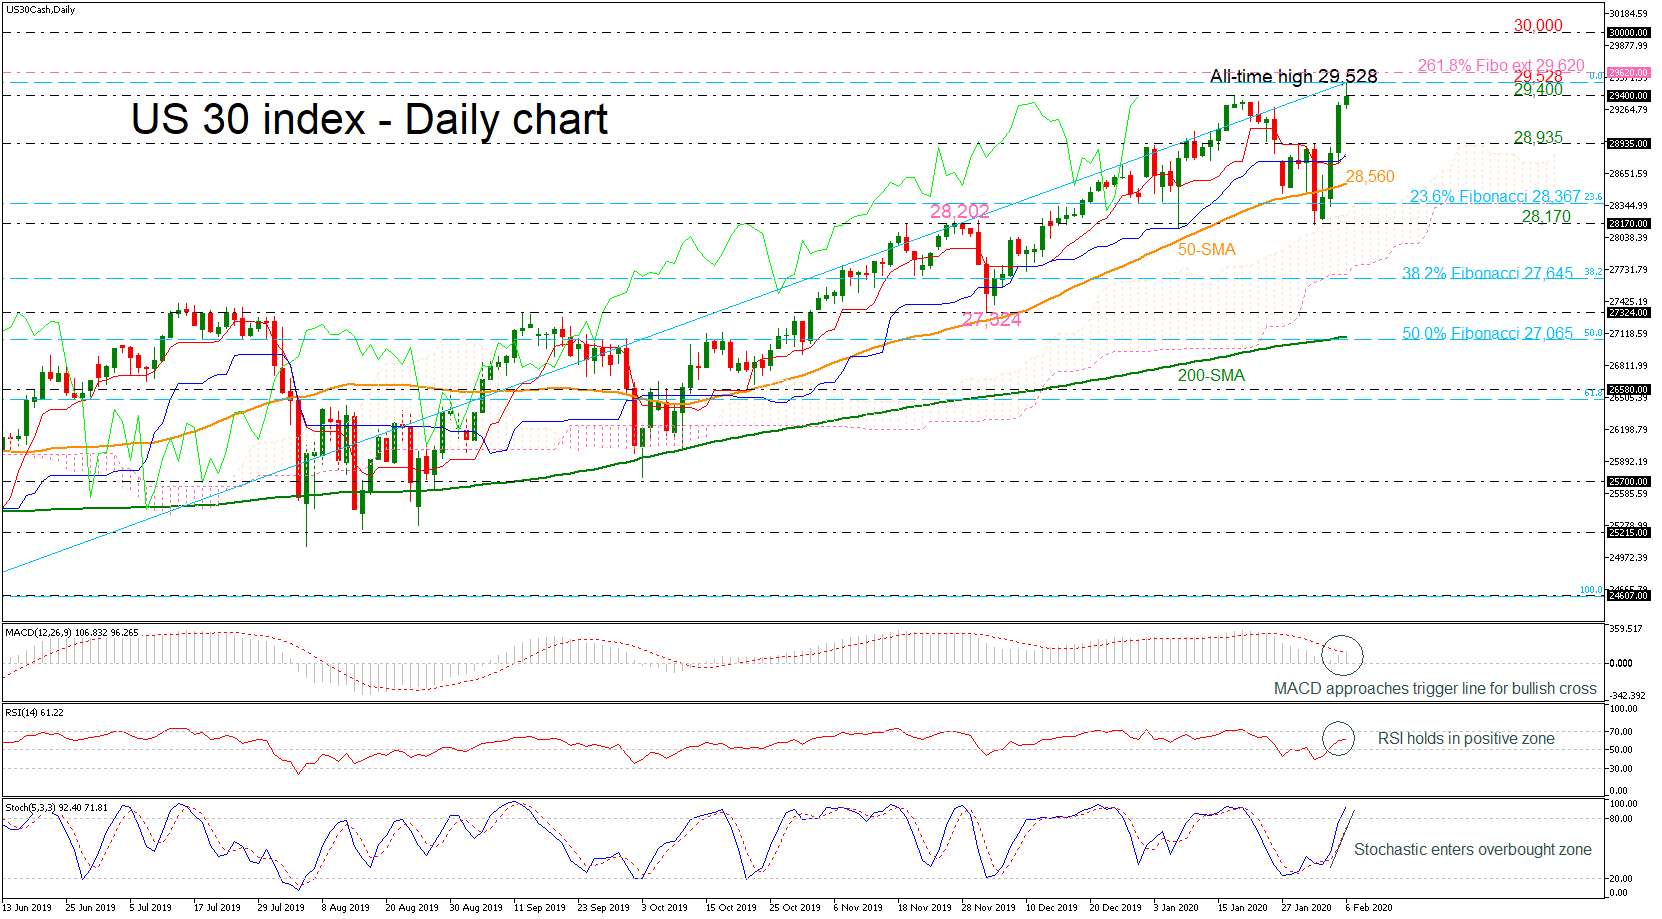
The US 30 index is looking strongly bullish after surging above its daily moving averages (MA) on Monday. Prices hit a record high of 29,528 earlier today and the technical indicators are all pointing to further positive momentum in the near term.
The stochastics are heading upwards, but the D% line has yet to cross above 80, suggesting plenty of scope for additional upside moves. The RSI has crossed into bullish territory but has yet to approach the 70 overbought level, while the MACD is ready for a bullish crossover with its trigger line above the zero mark.
Overtaking the all-time high, the 29,620 immediate resistance – which is the 261.8% Fibonacci extension of the down leg from 28,202 to 27,324 – could come in focus. If buyers persist, the 30,000 psychological number could be next to draw traders’ attention.
Otherwise, if the market weakens below the 29,400 support, the 28,935 barrier from the inside swing on January 31 could be next to pause the decline. Moving lower, the 50-day simple moving average (SMA) at 28,560 and the 23.6% Fibonacci retracement level of the upward rally from 24,607 to 29,528, near 28,367 could halt the test of the trough of 28,170 beneath, which is sustaining the positive picture.
Overall, the US stock index remains strongly bullish with no major downside correction in the long-term.


