
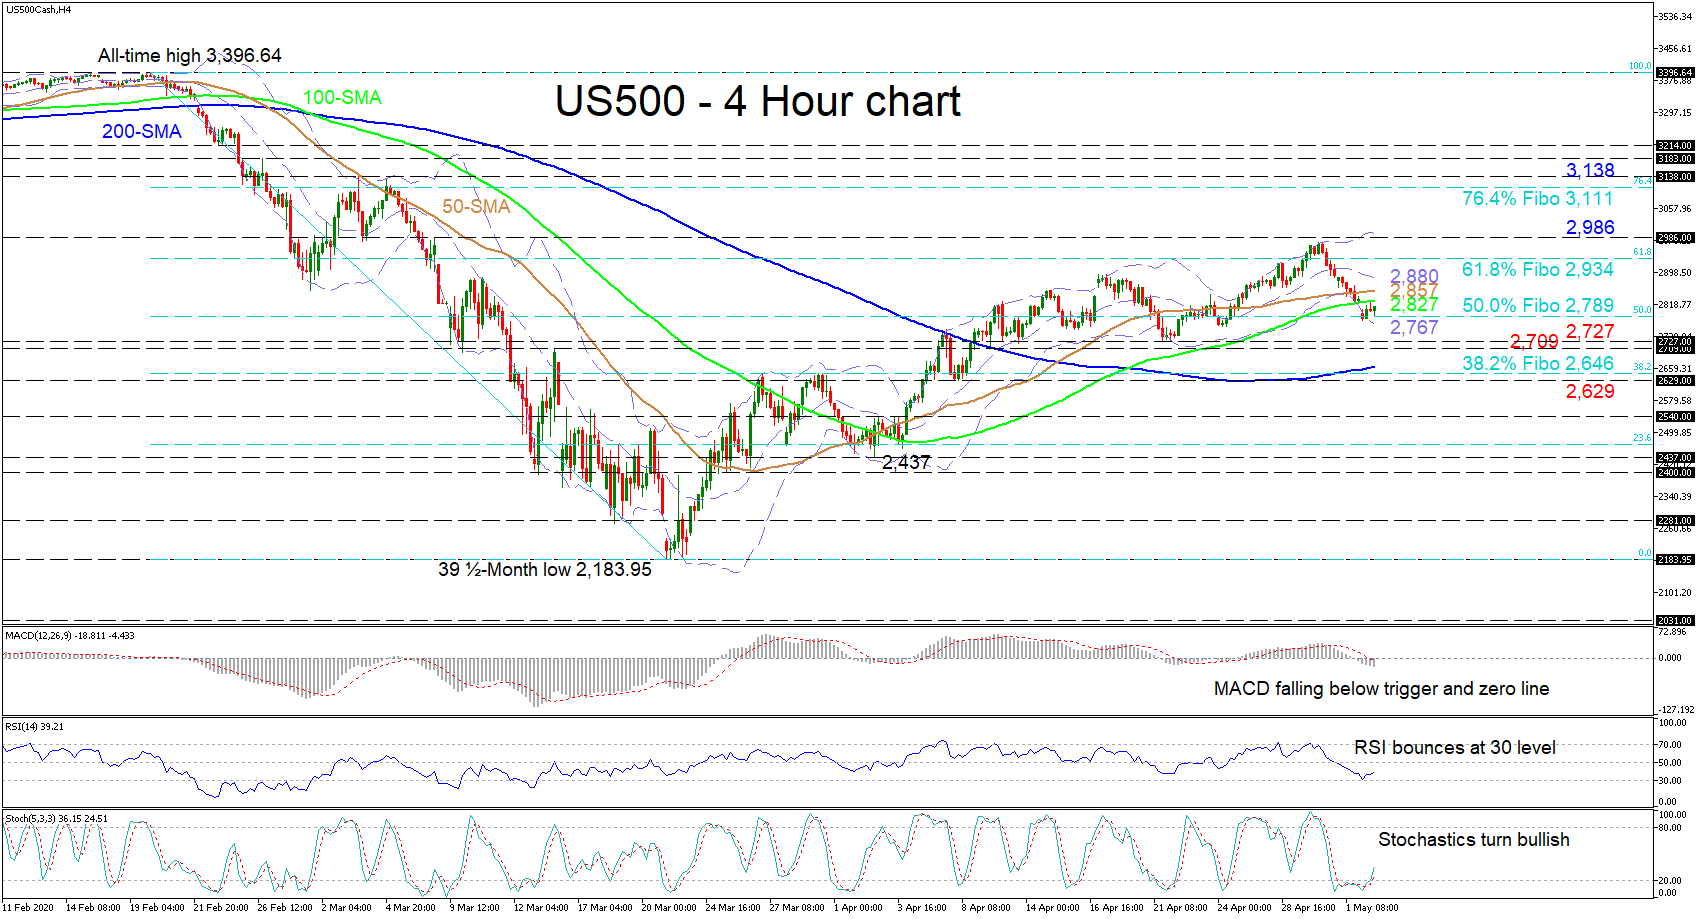
US 500 stock index (Cash) is inactive at the 2,789 level, that being the 50.0% Fibonacci retracement of the down leg from the all-time high of 3,396.64 till the 2,183.95 low. The price appears stuck between the lower Bollinger band of 2,767 and the 100-period simple moving average (SMA) at 2,827.
Turning to the short-term oscillators, the RSI and the stochastics promote advances as does the 200-period SMA, which is building an incline. Moreover, the 50- and 100-period SMAs still hold their bullish bearing. However, the price has dipped below the 50-and 100-period SMAs and the MACD confirms this negative momentum, as it is declining in the bearish zone below its red trigger and zero lines.
If sellers manage to push past the 50.0% Fibo of 2,789 and the lower Bollinger band at 2,767 beneath, a key support area from 2,727 – 2,709 could initially challenge the drop. On that note, a dive through another important support section, from the 200-period SMA until the 2,629 trough of April 8 – encapsulating the 38.2% Fibo of 2,646 – could throw into question the correction from the low of 2,183.95.
Alternatively, if buyers succeed in overrunning the area of restrictions from 2,827 to 2,880 – involving the 50- and 100-period SMAs as well as the mid-Bollinger band – the 61.8% Fibo at 2,934 is next to deliver doubt towards the ascent. Moving higher the 2,986 high and upper Bollinger band could deny further advances towards the 76.4% Fibo of 3,111 and the 3,138 peak.
All in all, the very short-term bias is neutral-to-bullish above 2,709. Yet, a close below the 2,629 trough could bring back worries of a downturn, and realign the index with a bigger negative picture.


 Interventions?")


