
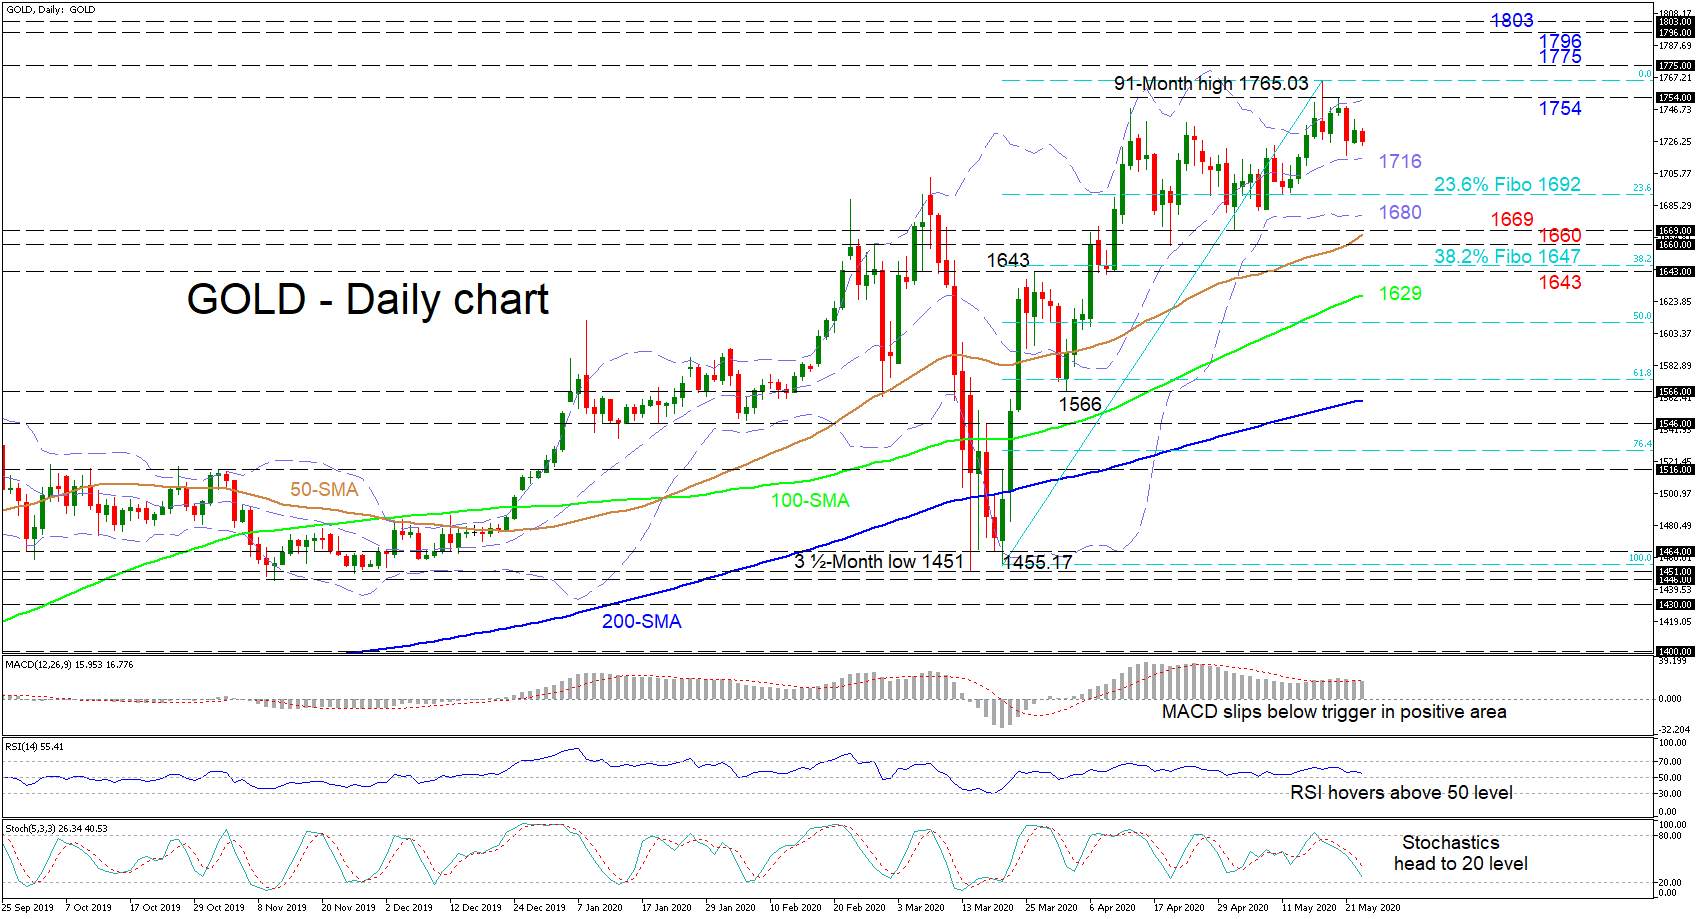
Gold appears to have somewhat weakened after plotting a fresh more than 7½-year high, stalling above the mid-Bollinger band at 1,716.
Though the short-term oscillators back a very short-term weakness in the price, the simple moving averages (SMAs) still maintain their strong positive charge, dictating a bigger positive bearing. The MACD is still in the positive region but has dipped below its red signal line, while the RSI points down, hovering above the 50 threshold. The stochastics also back the negative weakness as they head to the 20 mark.
To the upside, through sufficient footing on the mid-Bollinger band, the pair may encounter initial coupled resistance from the upper Bollinger band nearby the 1,754 high, ahead of the fresh 91-month peak of 1,765.03. Surpassing this top, the precious metal may challenge the 1,775 obstacle before thrusting for the 1,796 and 1,803 peaks, from October of 2012 and November 2011 respectively.
If sellers manage to push under the mid-Bollinger band at 1,716, support may stem from the 1,692 level, which is the 23.6% Fibonacci retracement of the up leg from 1,455.17 to the multi-year high of 1,765.03. Steering underneath, the lower Bollinger band at 1,680 and the troughs of 1,669 and 1,660 – which capture the 50-day SMA – may bring the decline to a halt. Failing to do so another significant limiting region, from the 38.2% Fibo of 1,647 till the 1,643 tough border, may test the push downwards.
Summarizing, the short-term timeframe maintains a positive bias and a break above 1,765.03 would repower this outlook. However, a move below 1,669 would return some worries for a downside shift.


")


