
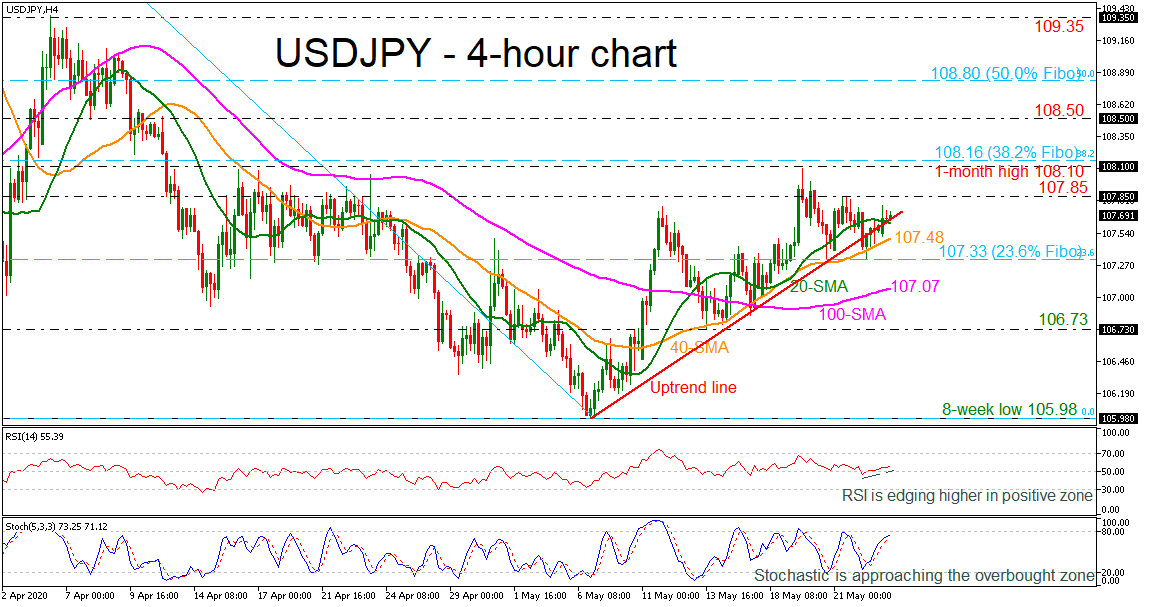
USDJPY has been developing near the three-week ascending trend line over the last sessions, finding support at the 23.6% Fibonacci retracement level of the down leg from 111.70 to 105.98 at 107.33. The pair seems to be bullish in the very short-term timeframe and the technical indicators agree with this bias. The RSI, in the positive area, is sloping up, while the stochastic is approaching the overbought territory.
In the event of more advances, the 107.82 level could act as a barrier before being able to re-challenge the one-month peak of 108.10 and the 38.2% Fibonacci of 108.16. A break above this hurdle could send the price towards the 108.80 obstacle and the 50.0% Fibonacci of 108.80.
On the other hand, a penetration of the rising trend line and the 20-period simple moving average (SMA) could cause the pair to flirt with the 40-period SMA at 107.48 before meeting 107.33, being the 23.6% Fibo. A drop below that would create a neutral profile and open the way for the 100-period SMA, currently at 107.07. Further losses could see the 106.73 low achieved on May 13.
Summarizing, USDJPY lies near the uptrend line and any declines below it could take prices to new neutral paths. However, more gains could lead the price towards the one-month peak again.

 Interventions?")


