
The EUR/USD currency pair
Technical indicators of the currency pair:
Prev Open: 1.10711
Open: 1.11148
% chg. over the last day: +0.16
Day’s range: 1.11024 – 1.11540
52 wk range: 1.0777 – 1.1494
The bullish sentiment prevails on the EUR/USD currency pair. The trading instrument has set new local highs. The European Commission has proposed to create a 750 billion euro recovery fund. The ECB meeting and the US labor market report for May will be key events on the current trading week. At the moment, EUR/USD quotes are testing the resistance of 1.1150. The 1.1090 mark is the nearest support. The single currency has the potential for further growth. We recommend following up-to-date information regarding the conflict between Washington and Beijing. Positions should be opened from key levels.
News Feed on the US Economy for 2020.06.01:
German manufacturing PMI at 10:55 (GMT+3:00);
ISM manufacturing PMI at 17:00 (GMT+3:00).
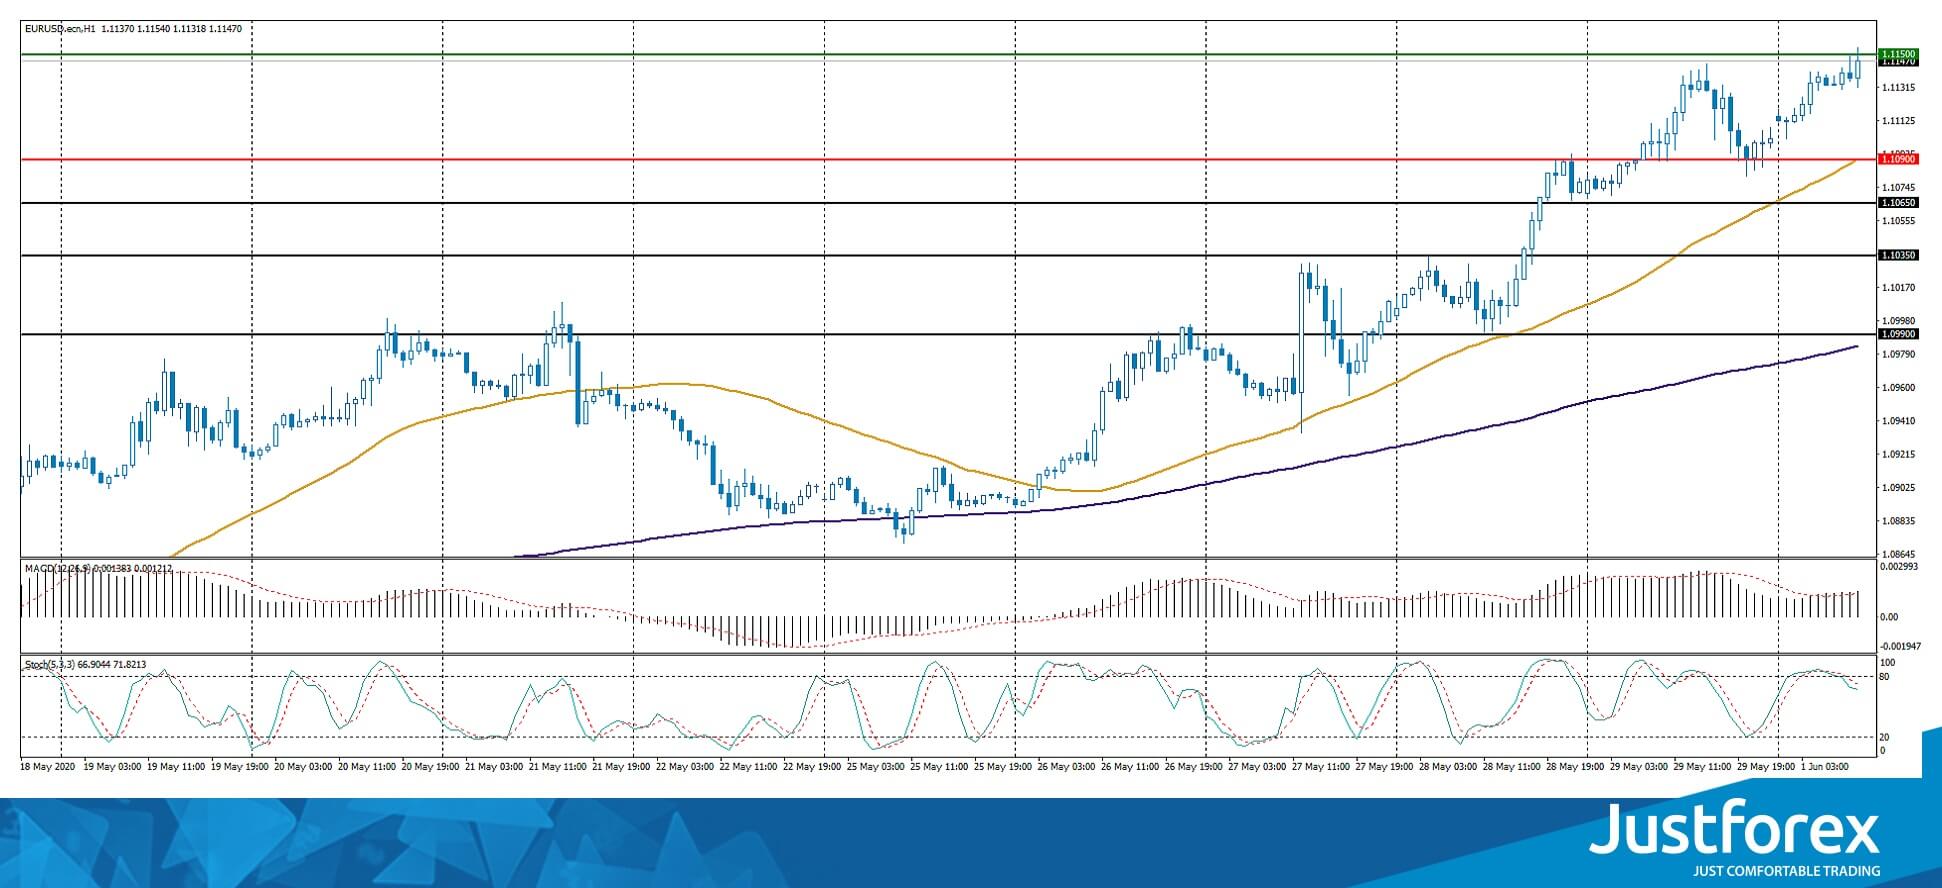
Indicators signal the power of buyers: the price has fixed above 50 MA and 100 MA.
The MACD histogram is in the positive zone, indicating the bullish sentiment.
Stochastic Oscillator has started exiting the overbought zone, the %K line is below the %D line, which indicates a possible correction of EUR/USD quotes.
Trading recommendations
Support levels: 1.1090, 1.1065, 1.1035
Resistance levels: 1.1150, 1.1180, 1.1200
If the price fixes above 1.1150, further growth of EUR/USD quotes is expected. The movement is tending to the round level of 1.1200.
An alternative could be a decrease in the EUR/USD currency pair to 1.1060-1.1040.
The GBP/USD currency pair
Technical indicators of the currency pair:
Prev Open: 1.23104
Open: 1.23235
% chg. over the last day: +0.21
Day’s range: 1.23235 – 1.24257
52 wk range: 1.1466 – 1.3516
Purchases prevail on the GBP/USD currency pair. The British pound has set new local highs. GBP/USD quotes have found resistance at 1.2425. The 1.2360 mark is already a “mirror” support. The current trading week will be full of important economic reports. Investors continue to monitor the development of the US-China conflict. We recommend opening positions from key levels.
At 11:30 (GMT+3:00), UK manufacturing PMI will be published.
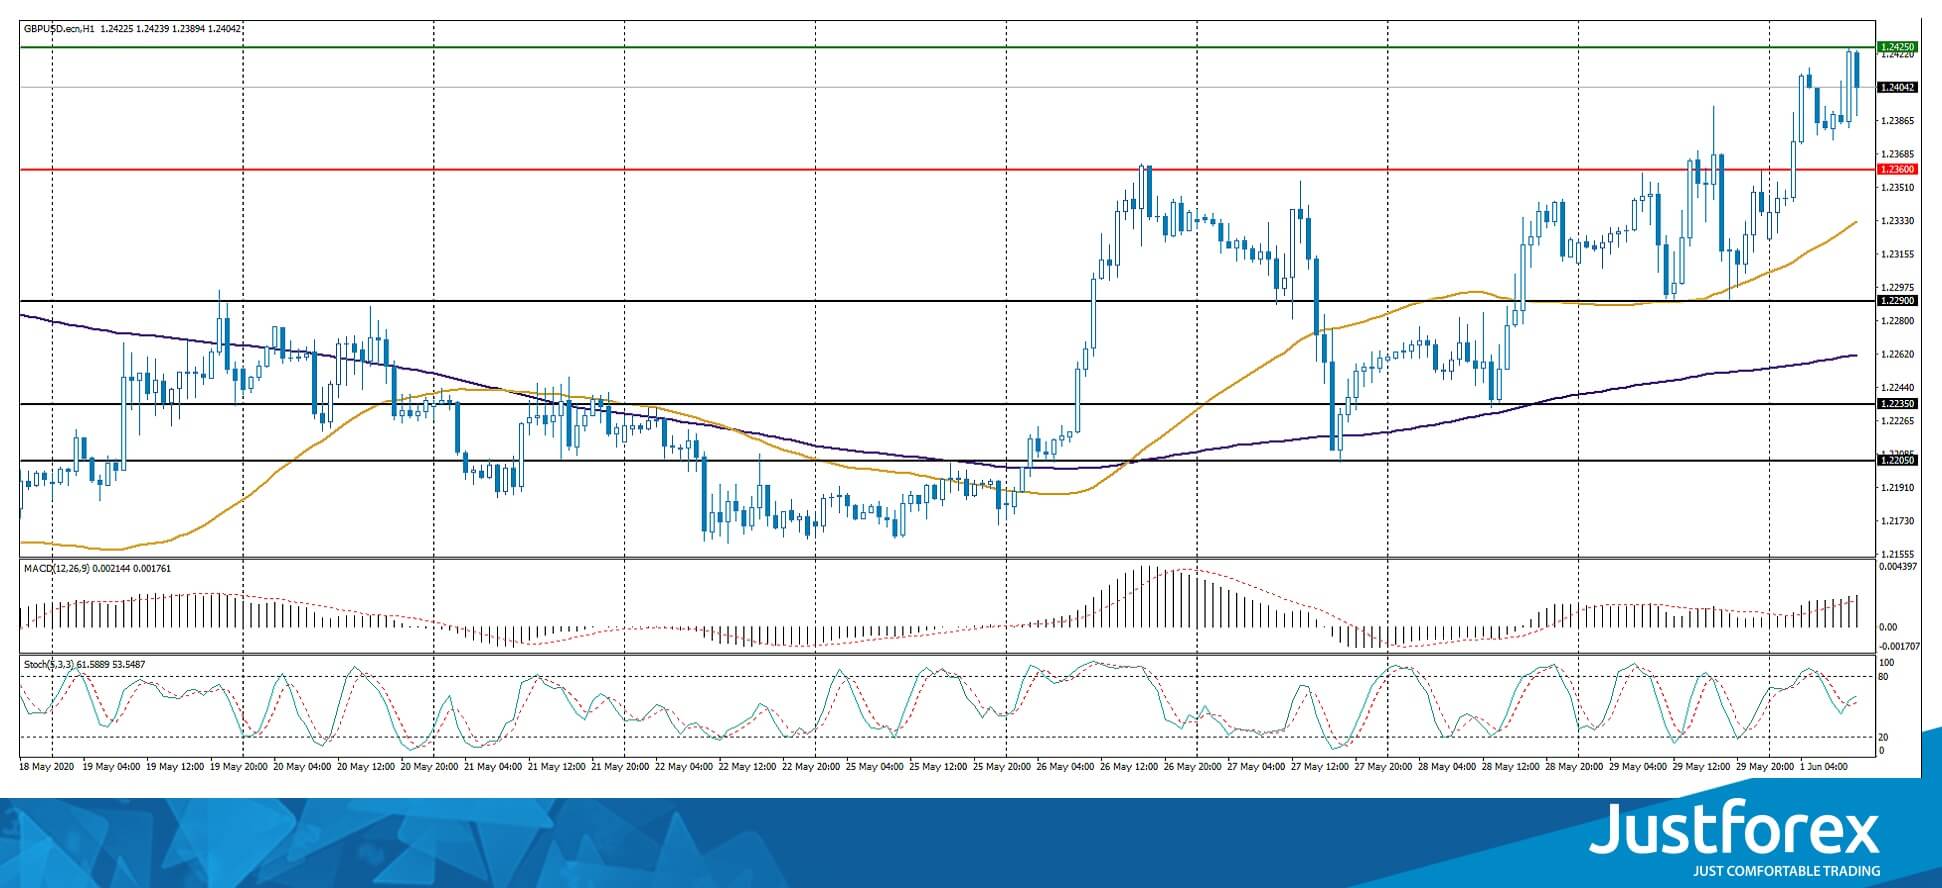
Indicators signal the power of buyers: the price has fixed above 50 MA and 100 MA.
The MACD histogram is in the positive zone and above the signal line, which gives a strong signal to buy GBP/USD.
Stochastic Oscillator is in the neutral zone, the %K line has crossed the %D line. There are no signals at the moment.
Trading recommendations
Support levels: 1.2360, 1.2290, 1.2235
Resistance levels: 1.2425, 1.2470, 1.2500
If the price fixes above 1.2425, further growth of GBP/USD quotes is expected. The movement is tending to 1.2470-1.2500.
An alternative could be a decrease in the GBP/USD currency pair to 1.2330-1.2300.
The USD/CAD currency pair
Technical indicators of the currency pair:
Prev Open: 1.37636
Open: 1.37748
% chg. over the last day: +0.13
Day’s range: 1.36732 – 1.38003
52 wk range: 1.2949 – 1.4668
The USD/CAD currency pair has been declining after a prolonged consolidation. The trading instrument has overcome and fixed below the key extremes. The loonie is currently testing the following support and resistance levels: 1.3675 and 1.3735, respectively. USD/CAD quotes have the potential for further decline. Today we recommend paying attention to economic releases from the US, as well as the dynamics of “black gold” prices. Positions should be opened from key levels.
The news feed on Canada’s economy is calm.
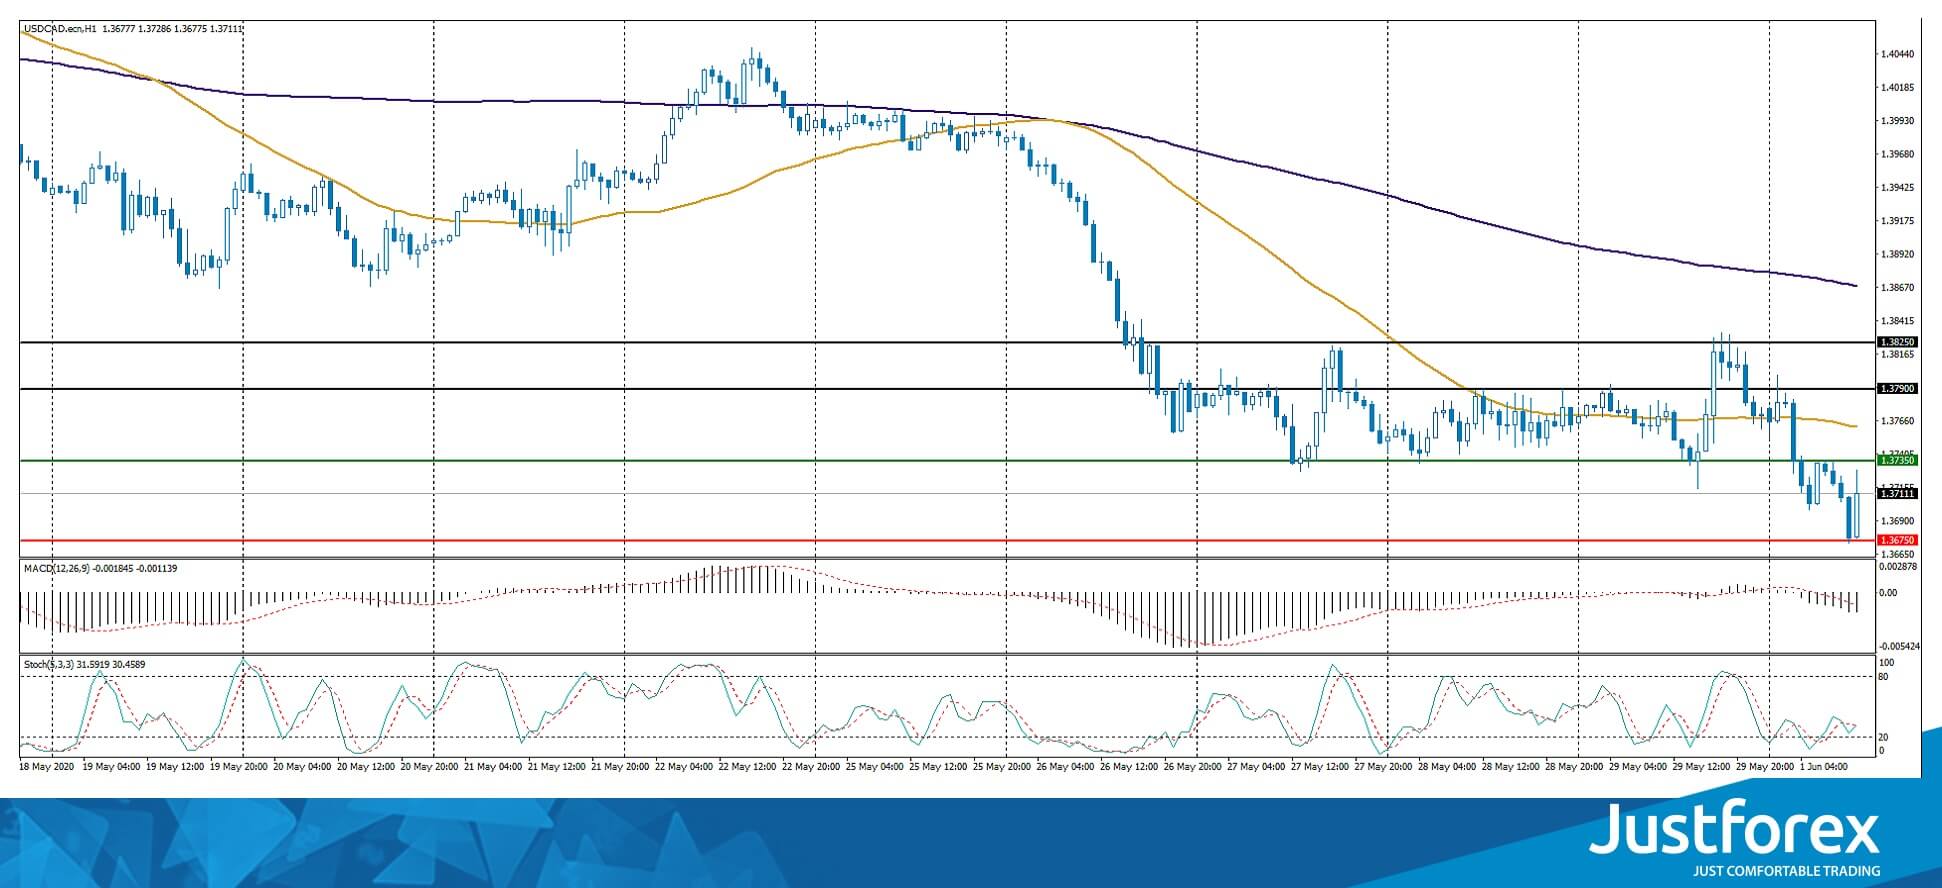
Indicators signal the power of sellers: the price has fixed below 50 MA and 100 MA.
The MACD histogram is in the negative zone, indicating the bearish sentiment.
Stochastic Oscillator is in the neutral zone, the %K line has crossed the %D line. There are no signals at the moment.
Trading recommendations
Support levels: 1.3675, 1.3630, 1.3600
Resistance levels: 1.3735, 1.3790, 1.3825
If the price fixes below 1.3675, a further drop in the USD/CAD quotes is expected. The movement is tending to 1.3640-1.3620.
An alternative could be the growth of the USD/CAD currency pair to 1.3780-1.3800.
The USD/JPY currency pair
Technical indicators of the currency pair:
Prev Open: 107.640
Open: 107.679
% chg. over the last day: +0.01
Day’s range: 107.375 – 107.856
52 wk range: 101.19 – 112.41
The last sessions trades on the USD/JPY currency pair have been very active. At the same time, there is no defined trend. The technical pattern is still ambiguous. Financial market participants expect additional drivers. At the moment, the key range is 107.35-107.60. Investors are focused on a trade conflict between Washington and Beijing. Positions should be opened from key levels.
The news feed on Japan’s economy is calm.
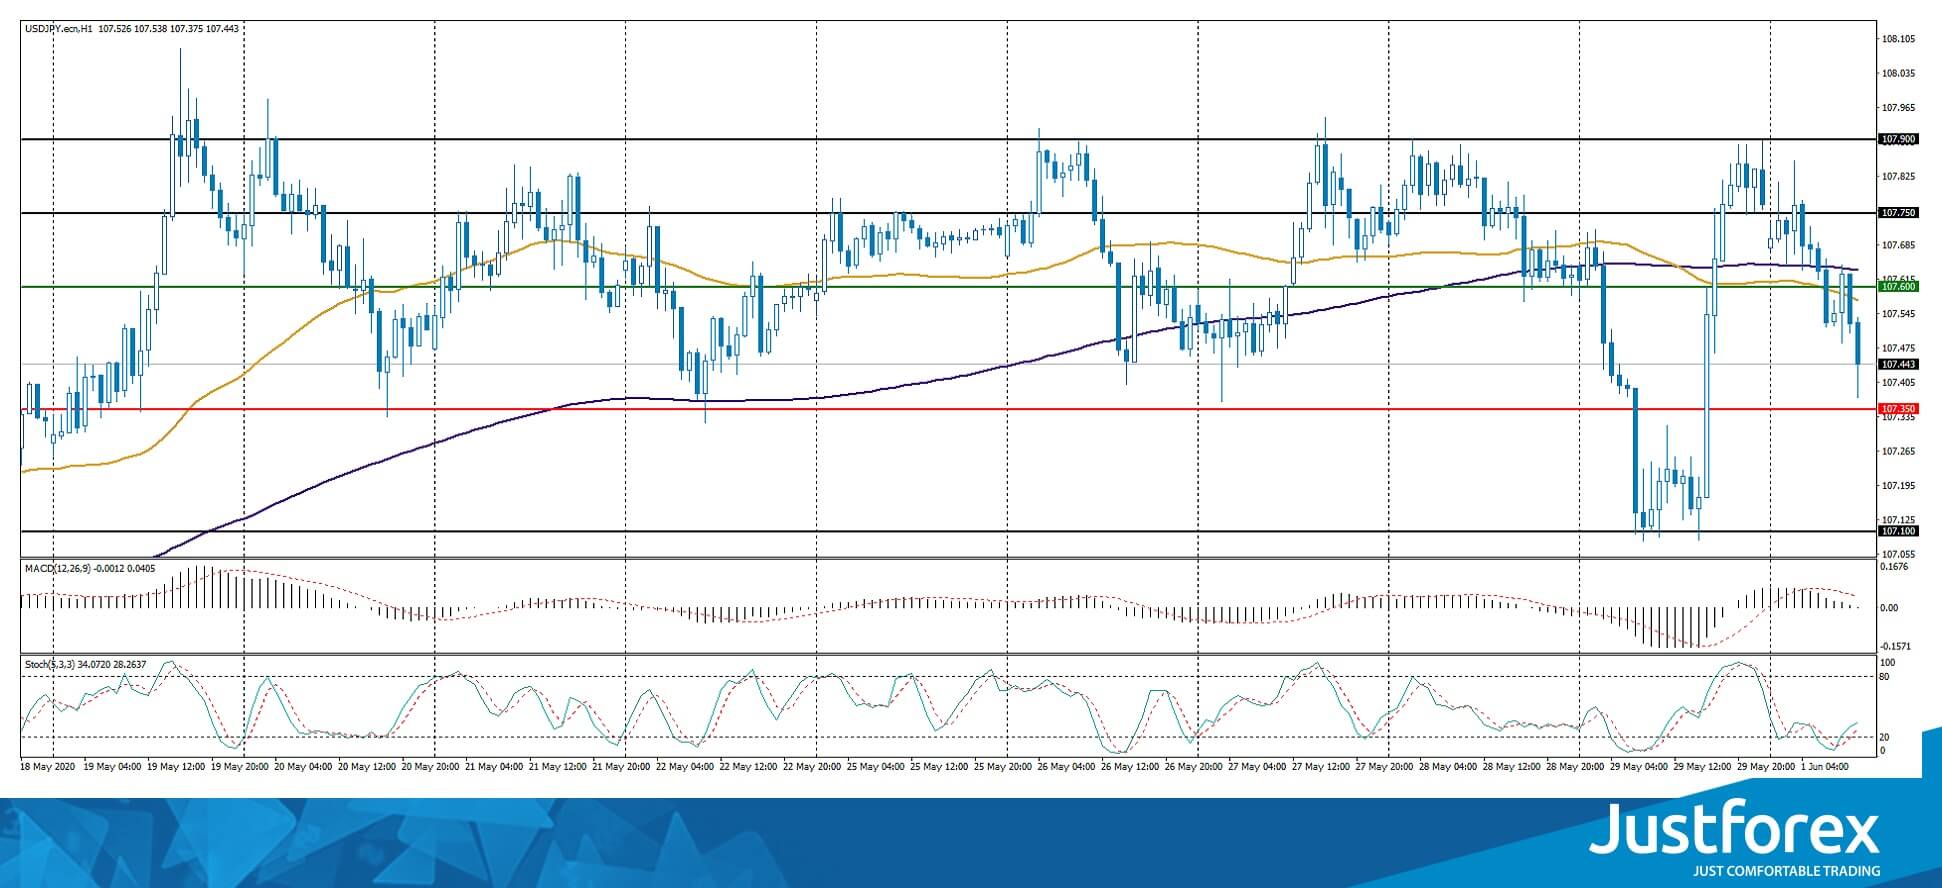
Indicators signal the power of sellers: the price has fixed below 50 MA and 100 MA.
The MACD histogram is near the 0 mark. There are no signals at the moment.
Stochastic Oscillator is in the neutral zone, the %K line is above the %D line, which gives a signal to buy USD/JPY.
Trading recommendations
Support levels: 107.35, 107.10, 106.80
Resistance levels: 107.60, 107.75, 107.90.
If the price fixes below 107.35, a further drop in the USD/JPY quotes is expected. The movement is tending to 107.10-106.90.
An alternative could be the growth of the USD/JPY currency pair to 107.75-107.90.


 Interventions?")


