
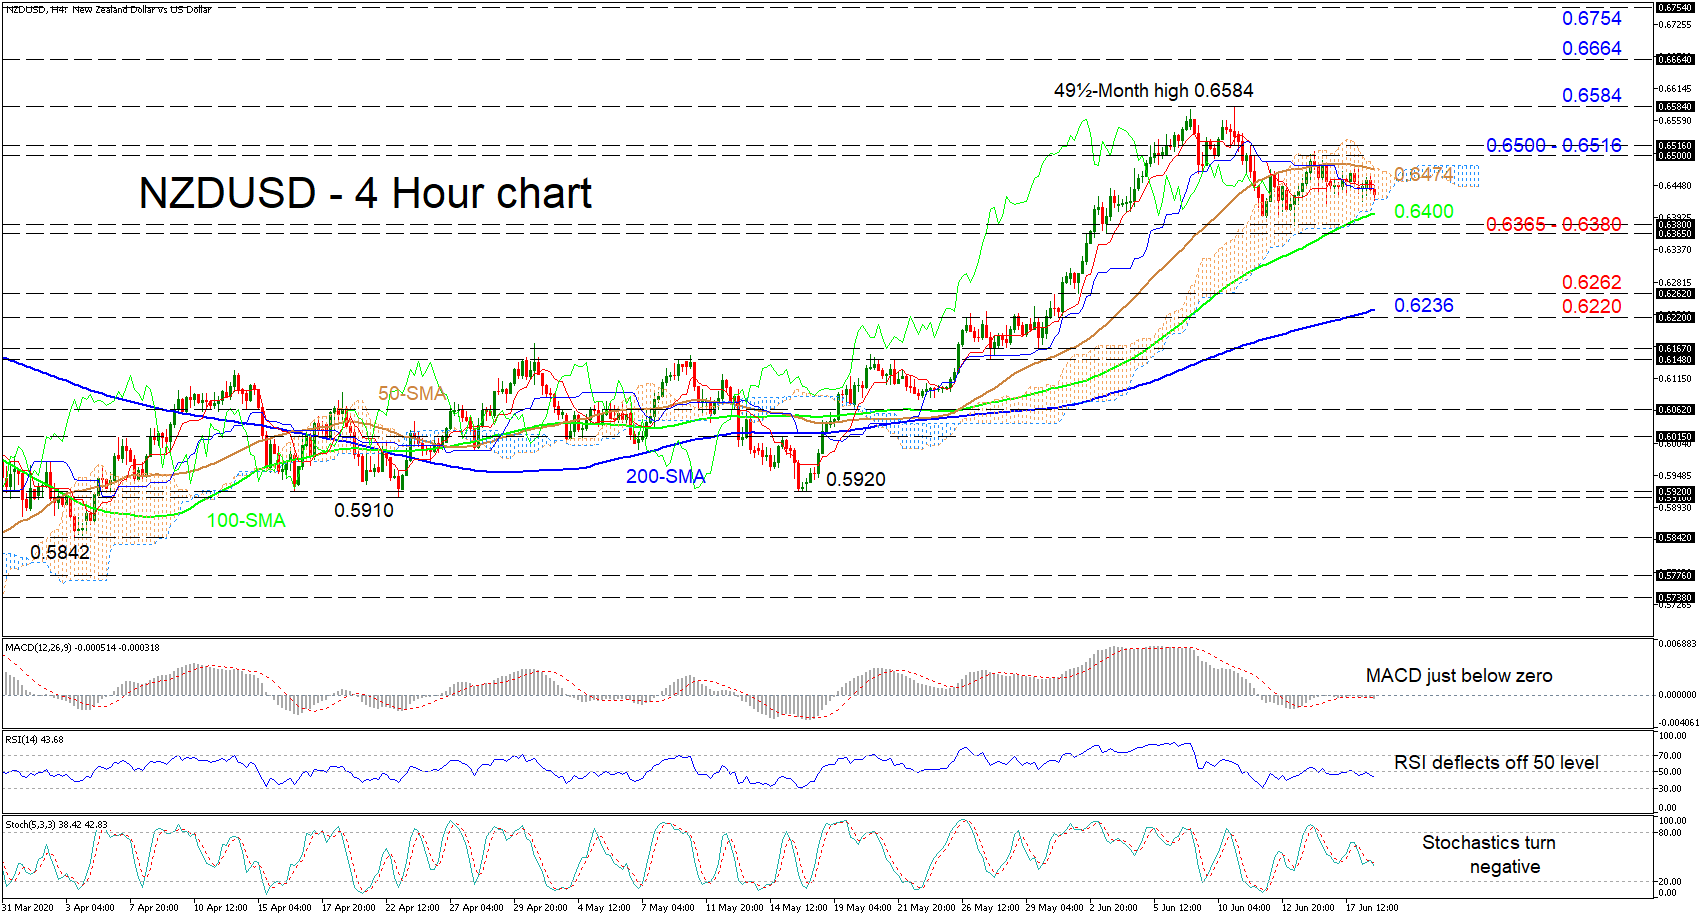
NZDUSD’s short-term bullish picture under scrutiny as the pair is presently resting on the lower band of the Ichimoku cloud. The latest sideways move may gain a negative boost should it dip under the cloud and the 50-period simple moving average (SMA) continue its gradual downturn.
At this time signals for directional momentum reflected in the Ichimoku lines and the MACD oscillator are unclear. However, the RSI is starting to head lower from its neutral mark while the stochastics have become negative heading towards the 20 area. Nevertheless, traders need to be aware of the prevailing positive bearing in the 100- and 200-period SMAs.
If sellers manage to pierce below the lower surface of the cloud, early limitations may arise from the 100-period SMA at 0.6400 ahead of a critical support region from 0.6365 – 0.6380. If this border fails to sustain the positive picture intact, the price may plummet towards another essential trough at 0.6262. A step underneath could then challenge the 200-period SMA at 0.6236 and the 0.6220 obstacle beneath.
Should the price bounce above the Ichimoku lines, the 50-period SMA of 0.6474 – at the upper line of the cloud – could hinder the climb before facing the resistance section of 0.6500 – 0.6516. A successful jump above could gain ground to revisit the 49½-month peak of 0.6584. A followed violation of the summit could shoot the price towards the 0.6664 and 0.6754 next barriers.
Concluding, at the moment the very short-term timeframe maintains a neutral-to-bullish bias above 0.6365 and a break of the 49½-month top would accelerate a bullish outlook.


