
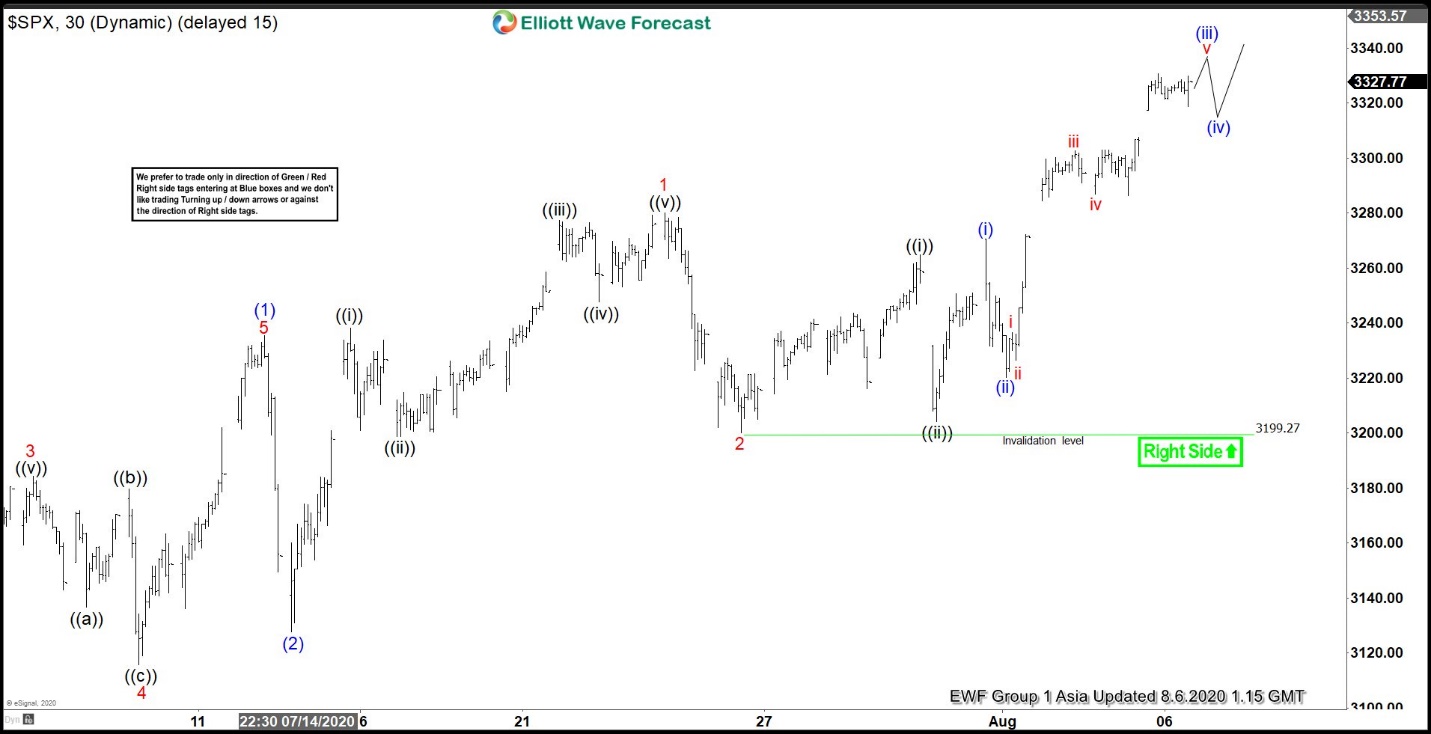
S&P 500 (SPX) 30 minutes chart below shows that the Index has ended the correction from July 14 high. From July 14 high, wave (2) ended at 3127.66 low. From there, the Index has continued to resume higher. The rally has already broken above July 14 high, confirming that the next leg higher has already started. Up from wave (2) low, the Index rallied higher in wave 1. The subdivision unfolded as a 5 waves impulse Elliott Wave Structure. Wave ((i)) ended at 3238.28 high and the pullback in wave ((ii)) ended at 3198.59 low. Afterwards, the Index resumed higher in wave ((iii)), which ended at 3277.29 high. Wave ((iv)) dips then ended at 3247.77 low. The final push higher in wave ((v)) ended at 3279.99 high. This ended wave 1 in larger degree.
Afterwards, the Index did a pullback in wave 2, which ended at 3199.27 low. The Index has resumed higher since then and has broken above previous wave 1 high, confirming that the next leg higher in wave 3 is currently in progress. As long as 3199.27 low stays intact, the dips in 3,7 or 11 swings is expected to find support for more upside.
S&P 500 (SPX) 30 Minutes Elliott Wave Chart


