
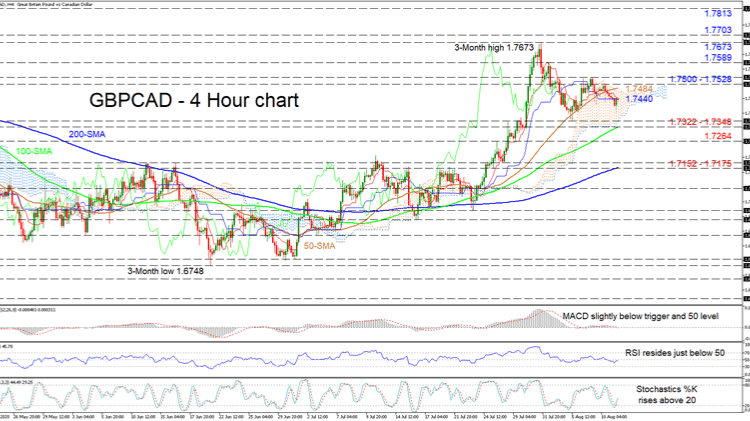
GBPCAD faded further into the Ichimoku cloud and dropped below the 50-period simple moving average (SMA), following the retracement from the three-month high of 1.7673 peak. The Ichimoku lines suggest a temporary stalled picture in positive directional momentum.
Nevertheless, signs of improvement are still evident in the rising SMAs and the stochastic oscillator. The rising %K line completed a bullish crossover of the %D line, exiting oversold territory, endorsing advances in the pair. The MACD and RSI remain just beneath their neutral marks, confirming the very short-term paused picture.
If buyers steer the pair above the mostly flat Ichimoku lines at 1.7440, initial friction to upside moves may develop from the cloud’s upper surface and the 50-period SMA around 1.7484, before the section of highs (1.7500 to 1.7528) overhead. Overtaking this zone, the pair may test the 1.7589 barrier before homing in on the 1.7673 peak. Further advances over the 1.7703 peak of May 1 may then pursue the 1.7813 resistance from March 11.
Otherwise, if the pair sinks further in the cloud, early hardened support may occur from the 1.7348 trough until the lower band of the cloud at 1.7322, where the 100-period SMA is currently located. If this region fails to halt the decline, the 1.7264 low may come into play. Diving further could then turn traders’ attention to another critical support region of 1.7152to 1.7175, which encompasses the 200-period SMA.
Concluding, the very short-term picture maintains a positive tone above the cloud and the 100-period SMA. Yet, trading appears trapped between 1.7322 and 1.7528 and a break either below or above could establish the next course.


