
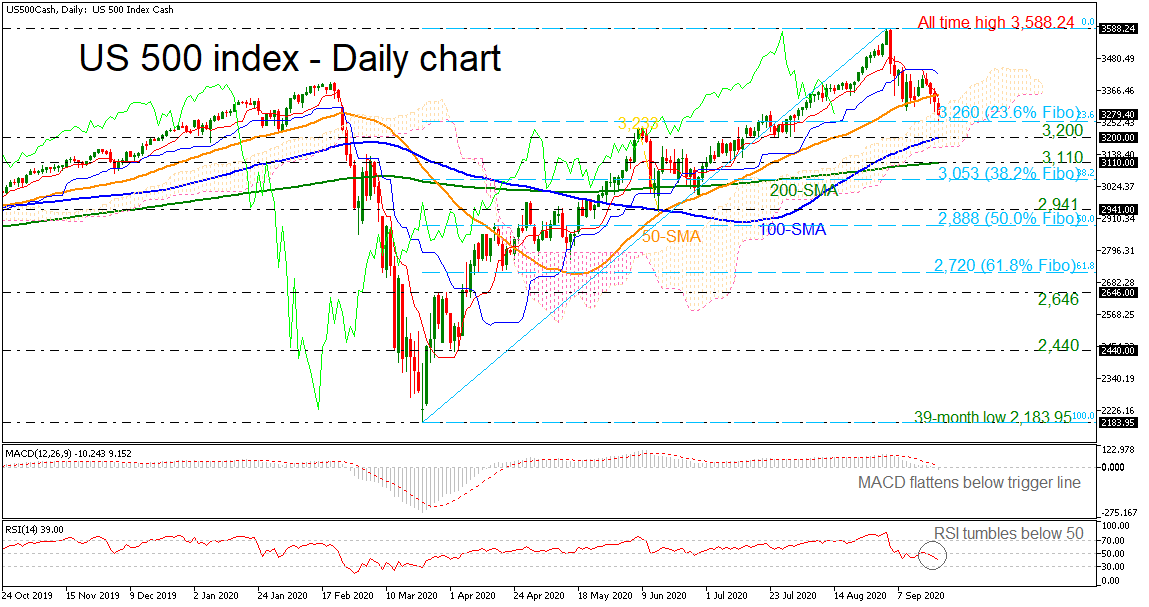
The US 500 (Cash) index is diving towards the 23.6% Fibonacci retracement level of the up leg from the 39-month low of 2,183.95 to the record high of 3,588.24 at 3,260. The declining move over the last three consecutive days drove the market beneath the 50-day simple moving average (SMA) and the technical indicators are confirming the recent bearish mode. The MACD is falling slightly below the zero level, while the RSI is slipping below the 50 level.
Steeper movements could send the index towards the 3,200 barrier, which overlaps with the 100-day SMA ahead of the 200-day SMA at 3,110. Underneath these obstacles, the 38.2% Fibonacci mark of 3,053 could attract sellers’ attention.
Otherwise, a rebound off the 23.6% Fibo could take the price until the 50-day SMA at 3,348 before meeting the blue Kijun-sen line at 3,423. Moving higher, the all-time peak of 3,588.24 achieved on September 2 may halt bullish actions.
Concluding, the US 500 index has been in a strong upside tendency since March 23 and only a daily close beneath the 200-day SMA may change this outlook to neutral.


