
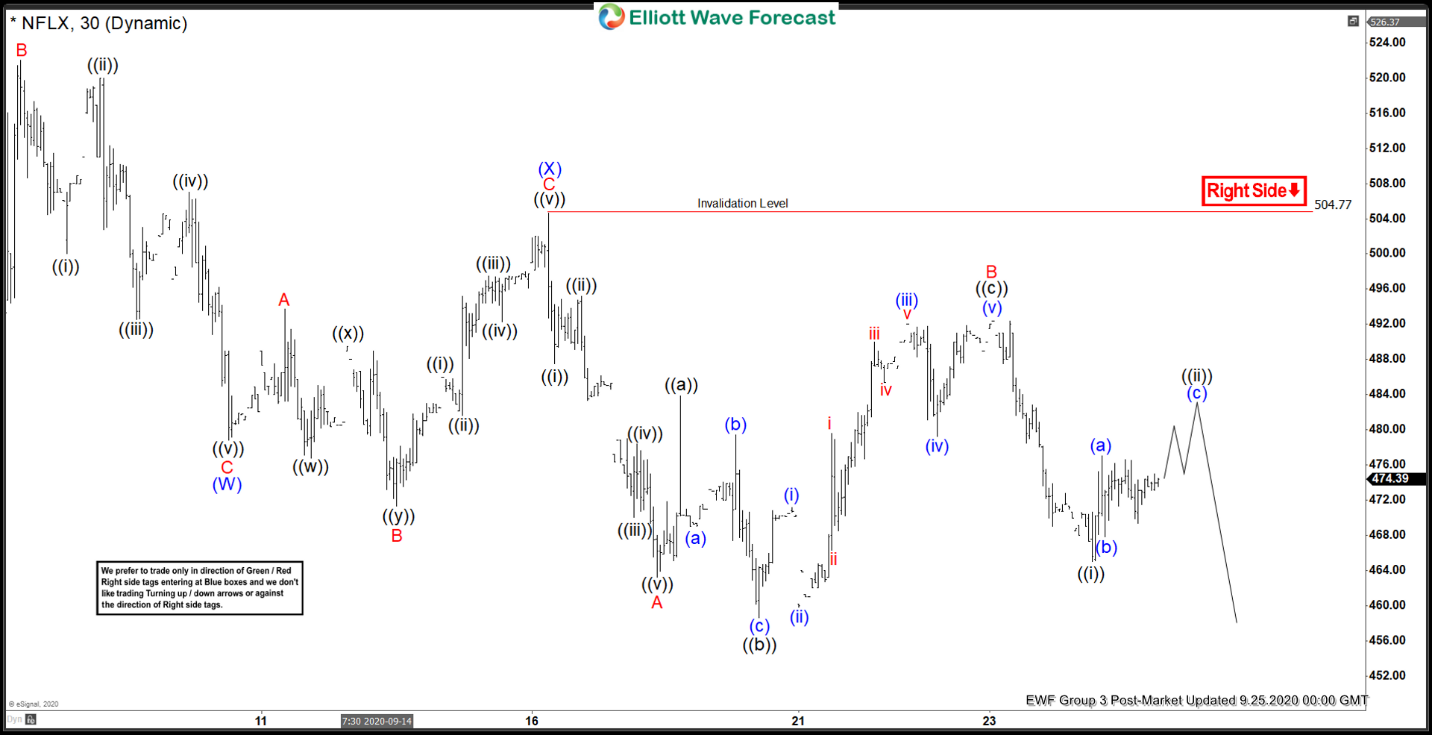
Elliott Wave view of Netflix (NFLX) suggests the stock is doing a double three correction from September 2 high. Down from September 2 high, wave (W) at 478.84 low. The subdivision unfolded at a zigzag correction, where wave A ended at 485.98 low, wave B ended at 522 high, and wave C ended at 478.84 low. Afterwards, the stock bounced higher in wave (X). The subdivision of the bounce unfolded as an expanded flat correction. Up from wave (W) low, wave A ended at 493.73 high. Wave B dip ended at 471.30 low. The push higher in wave C ended at 504.77 high, which also ended wave (X) in the higher degree.
Since then, the stock has resumed lower and broken below previous wave (W), confirming the next leg lower in wave (Y) has started. Down from wave (X), wave A ended at 463.27 low. The bounce in wave B unfolded as another expanded flat and ended at 492.37 high. Currently, wave C is in progress. Wave ((i)) of C ended at 465 low. The bounce in wave ((ii)) is still unfolding as zigzag correction. While below 504.77 high, expect the bounces in 3, 7, or 11 swing to fail for more downside in the near term. The 100-123.6% extension of wave A-B where C can potentially ends is at 441.36-451.13.
Netflix (NFLX) 30 Minutes Elliott Wave Chart


