
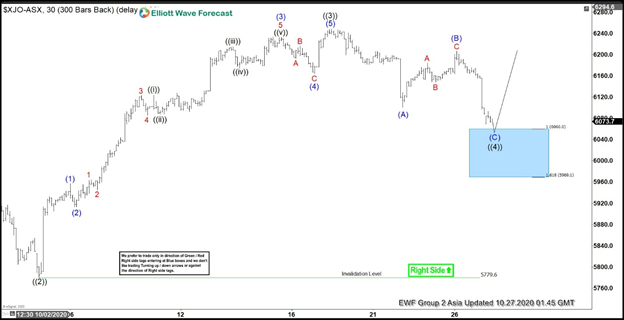
Short term Elliott Wave View in ASX 200 (XJO) suggests that cycle from September 22, 2020 low is in progress as a 5 waves impulse structure. In the 30 minutes chart below, Index ended wave ((2)) of this impulsive move from September 22 at 5779.6. Wave ((3)) higher ended at 6248.3 with internal subdivision as another impulse of lesser degree. Up from wave ((2)) low at 5779.6, wave (1) ended at 5957.1 and wave (2) pullback ended at 5912.7. Index then resumed higher in wave (3) towards 6232.8 and wave (4) dips ended at 6165. Final leg higher wave (5) ended at 6248.3. This completed wave ((3)) in the higher degree.
Wave ((4)) pullback is currently in progress to correct cycle from October 2 low as a zigzag. Down from wave ((3)) at 6248.3, wave (A) ended at 6100.6 and wave B bounce ended at 6206.5. Index then turned lower in wave (C) and it has reached the 100% extension area at 5969 – 6060. Buyers may appear from this area for more upside or a 3 waves bounce at least. As far as wave ((2)) pivot at 5779.6 low stays intact, expect the Index to turn higher from the blue box in 3 waves at least.
ASX 200 1 Hour Elliott Wave Chart


