
AUDUSD shows an incomplete sequence from September 1 peak favoring further downside. The decline from there is unfolding as a zigzag Elliott Wave structure. Down from September 1 peak (0.741), wave ((A)) ended at 0.7 and wave ((B)) ended at 0.724. Pair is currently within wave ((C)) lower and the subdivision of this wave ((C)) is in 5 waves, as 45 minutes chart below shows.
In the short term chart below, wave (1) of ((C)) ended at 0.7017. Bounce in wave (2) of ((C)) ended at 0.7158 as a double zigzag. Up from wave (1) low at 0.7017, wave W ended at 0.713, wave X ended at 0.708 and wave Y ended at 0.7158. Pair has since resumed lower and broken below wave (1) at 0.7017, suggesting the next leg lower has started.
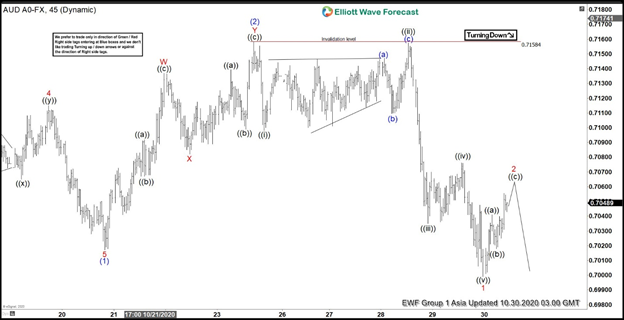
Down from wave (2) at 0.7158, wave ((i)) ended at 0.7098, and bounce in wave ((ii)) ended at 0.715. Pair then continued lower in wave ((iii)) towards 0.703 and wave ((iv)) ended at 0.707. Final leg lower in wave ((v)) ended at 0.7. This 5 waves move lower completed wave 1 of (3). Expect wave 2 bounce to fail below 0.715 for more downside. As far as pivot at 0.715 high stays intact, rally should fail in 3, 7, or 11 swing for more downside.
AUD/USD 45 Minutes Elliott Wave Chart


 Interventions?")

