
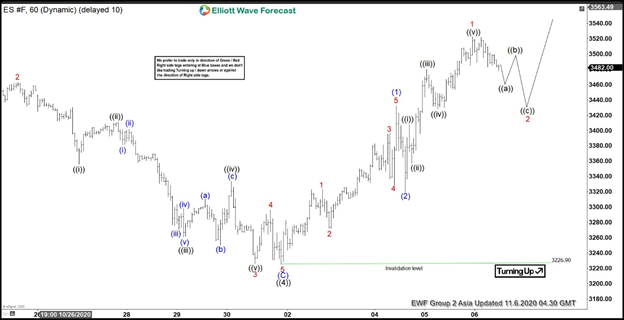
Short Term Elliott Wave View in S&P 500 E-Mini Futures (ES) suggests that the Index remains within the cycle from March low as an impulse Elliott Wave structure. The 60 minutes chart below shows the Index ended wave ((4)) at 3226.90 and it has resumed higher. Up from wave ((4)) low at 3226.90, 1 ended at 3323.5 and pullback in wave 2 ended at 3272. Index resumed higher in wave 3 towards 3397 and wave 4 pullback ended at 3328.50. Index then extended in wave 5 towards 3432.25. This completed wave (1) in higher degree.
Pullback in wave (2) then ended at 3319. Index has then resumed higher within wave (3). Up from wave (2) low at 3319, wave ((i)) ended at 3408 and pullback in wave ((ii)) ended at 3357. Wave ((iii)) ended at 3480, wave ((iv)) dips ended at 3428.25, and wave ((v)) higher ended at 3522.50. This completed wave 1 of (3) in higher degree. Wave 2 pullback is now in progress to correct cycle from November 4 low in 3, 7, or 11 swing before the rally resumes. As far as pivot at October 31 low (3226.90) stays intact, expect the Index to see further upside.
S&P 500 E-Mini Futures (ES) 60 Minutes Elliott Wave Chart


