
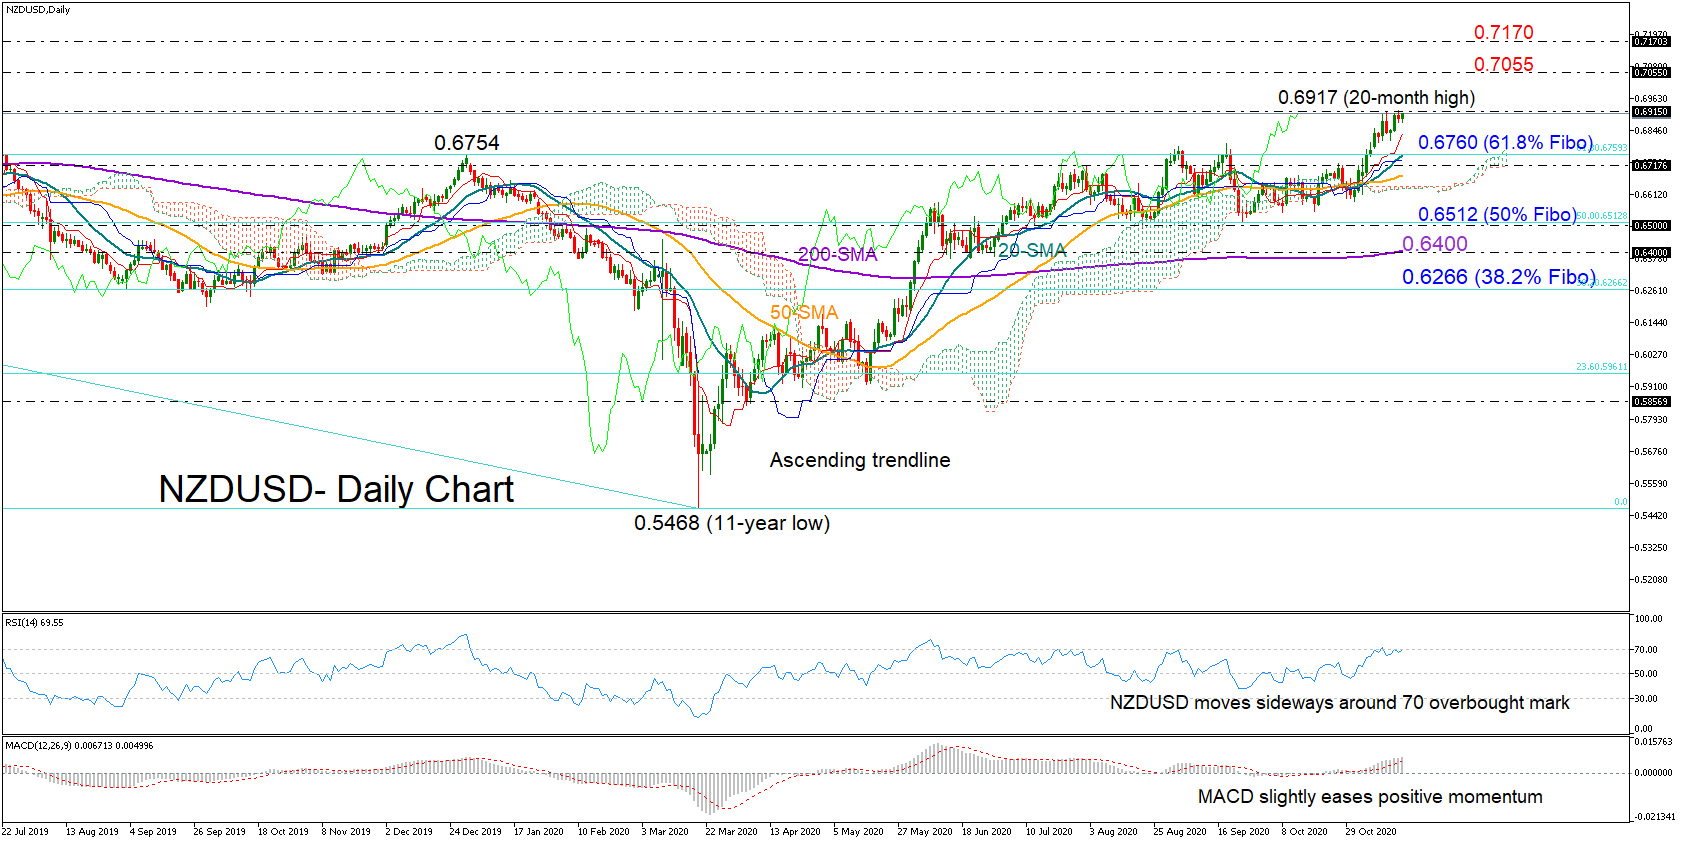
NZDUSD bulls picked up steam to a 20-month high of 0.6917 following the close above 0.6760, where the frequently tested 61.8% Fibonacci retracement of the long 0.7557 – 0.5468 downleg is placed.
The recent bullish action could fade in the short term as the price is currently challenging a key ceiling from 2019 and the RSI seems unable to post a fresh peak above its 70 overbought mark. The MACD also looks to be losing momentum within the positive area, though this is not sufficient evidence for a downside correction yet, unless both indicators show a convincing downward reversal.
Hence, the short-term bias remains tilted to the upside and the price is targeting the 0.7055 key restrictive zone, which has been occasionally acting both as support and resistance over the past four years. Not far above, the 0.7170 level may gather interest too given its supportive action during the 2017 – 2018 period.
In the event the bears take control, the 61.8% Fibonacci of 0.6760 and the 20-day simple moving average (SMA) could act as a floor, deterring any move towards the 50% Fibonacci 0.6512. A clear break below the latter would violate the uptrend that started from the 0.5468 bottom and switch the medium-term profile to a neutral one. In this case the 200-day SMA and the 38.2% Fibonacci of 0.6266 could next draw attention.
In brief, NZDUSD is currently looking bullish, though with the price having reached an important barrier, downside corrections cannot be ruled out.


 Interventions?")


