
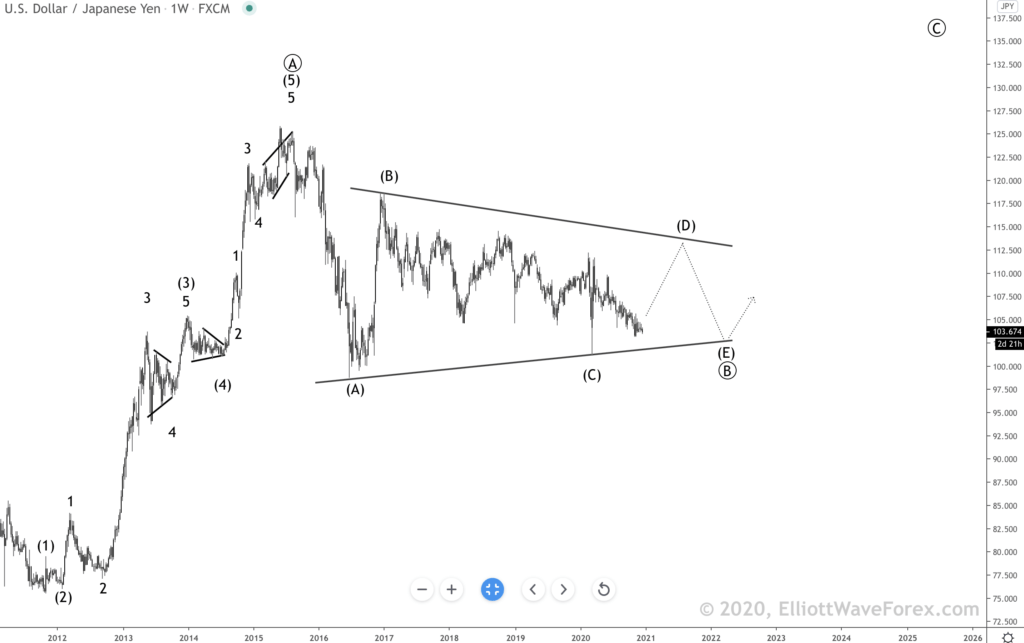
USD/JPY, Weekly chart. There’s no change to the outlook. There’s an upward impulse, which supposed to be wave ((A)). The following correction is likely taking the form of a triangle. The market should continue unfolding wave (D) inside the pattern as long as the price remains above the low of wave (C).
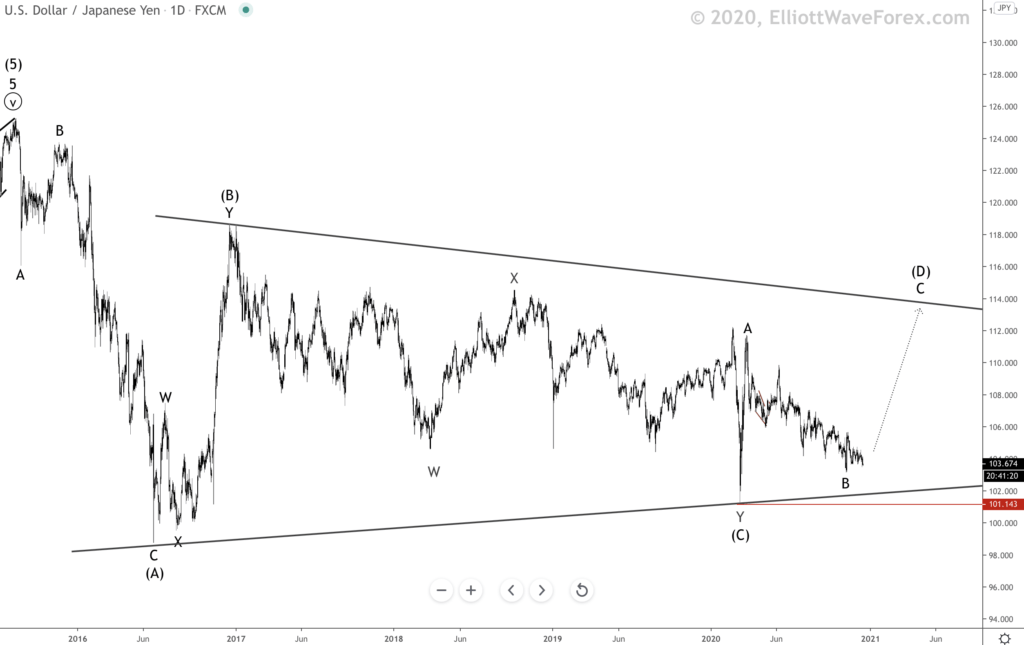
USD/JPY, Daily chart. Triangle’s wave (C) finished as a double zigzag. Also, there’s an upward impulse, which is likely wave A of (D). Wave B might have been in place, so we could be at the early stages of wave C of (D). The main critical level for this scenario is the low of wave A (101.14).


 Interventions?")

