
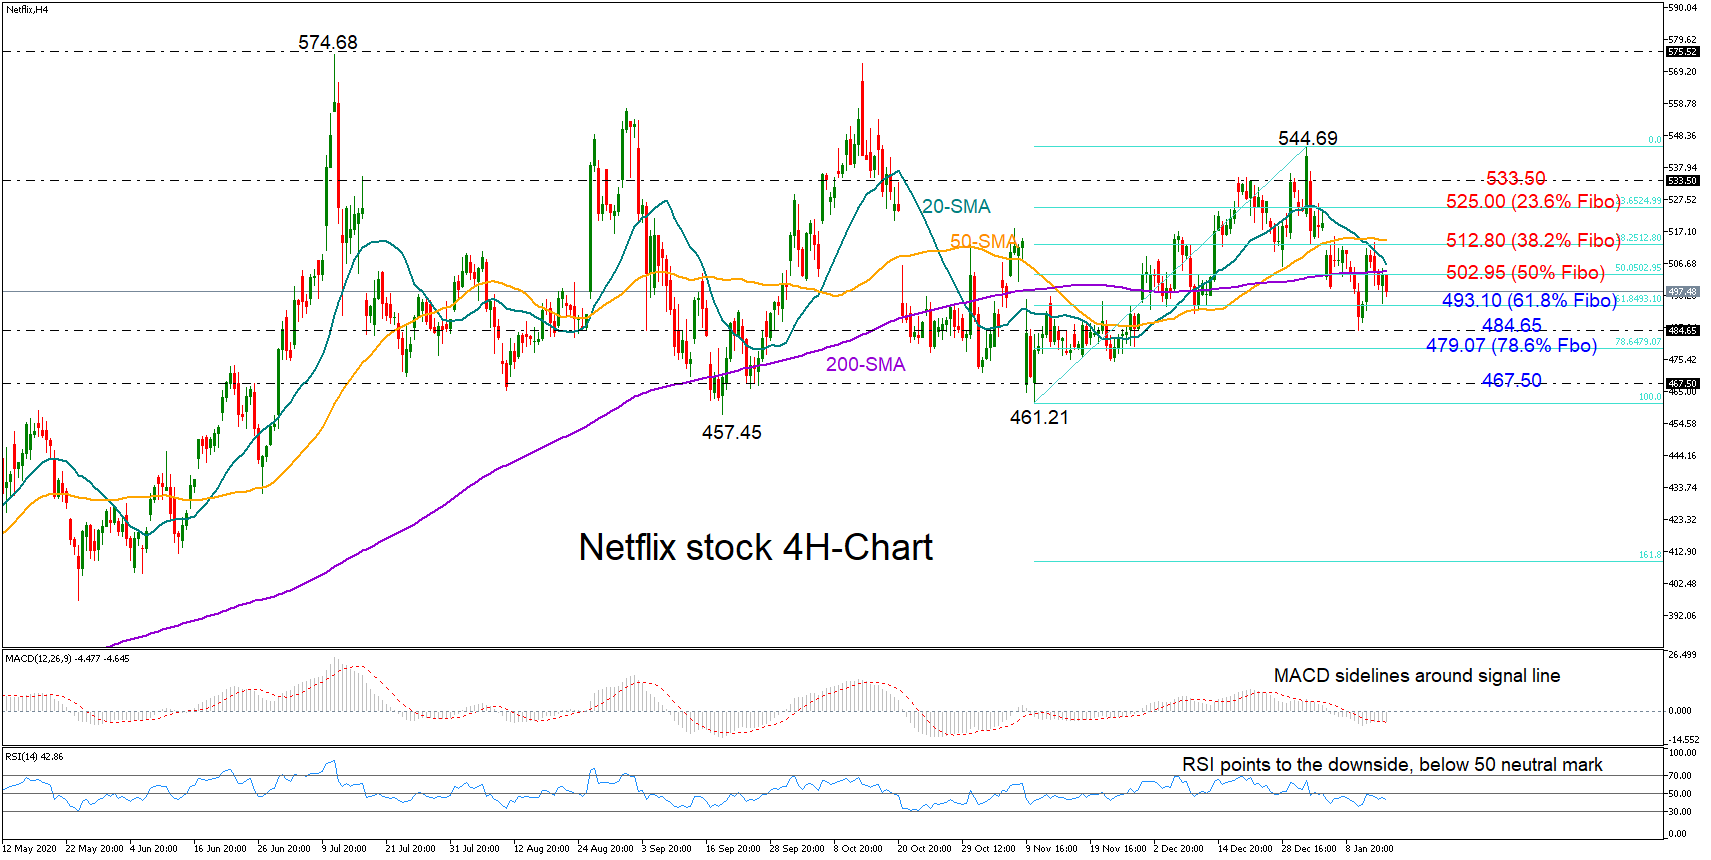
Netflix’s stock has been volatile within the range of 457.45 – 574.68 since mid-June, though in the four-hour chart, the simple moving average lines (SMAs) seem to have been navigating the price to the downside over the past two weeks.
The negative slope in the RSI and the trendless negative MACD are currently keeping the odds for a significant upside reversal minimal, suggesting that a drop towards the 61.8% Fibonacci level of the latest upleg at 493.10 could be more likely. If sellers manage to beat that obstacle, the next challenge could emerge between the 484.80 swing low and the 78.6% Fibonacci of 479.07. Lower, the bears may gear towards the 467.50 barrier.
On the upside, the 50% Fibonacci of 502.95 and the 20- and 200-period SMAs are capping positive movements. Hence, a close above that resistance is likely needed to strengthen the price towards the 38.2% Fibonacci of 512.80 and the 50-period SMA. Then, a more aggressive upturn could develop towards the 23.6% Fibonacci of 525.00, while even higher, another important battle could take place around 533.50.
Summarizing, Netflix’s stock is showing no clear direction in the bigger picture, though in the very short term, a sustainable correction above 502.95 or below 493.10 could determine the next move in the market.
Note that the famous streaming platform is scheduled to report its earnings for the final quarter of 2020 on Tuesday after the market close.


