
Price slips lower on the bearish pressure and looks very heavy on the short term, even if the USDX has slipped lower as well. Is challenging a critical support level, a valid breakdown will signal a broader drop on the Daily chart. Right now is better to stay away till we’ll have a clear direction, at this moment we don’t have a trading opportunity. GBP/USD stays lower despite the mixed United States data, the greenback would have appreciated much more if the New Home Sales would have come in lines with expectations or better.
Unfortunately, the New Home Sales plunged from 630K to 571K in July, even if the economists have expected to see an increase to 611K. You should keep an eye on the economic calendar tomorrow because we have some high impact data.
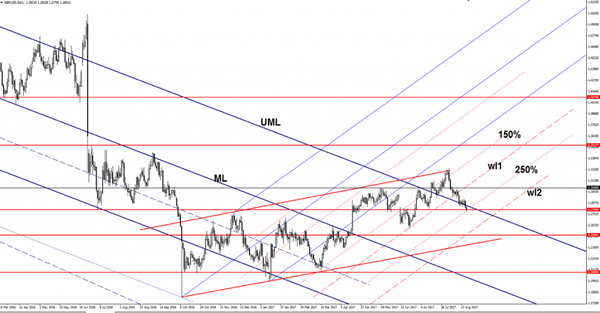
It is pressuring the 1.2798 static support right now, actually, is trying to breakdown through the confluence area formed between the 1.2798 level with the 250% Fibonacci line (ascending dotted line). A valid breakdown will accelerate the sell-off, which will approach the next downside target from the second warning line (wl2).
Technically should drop much deeper after the breakdown below the first warning line (wl1) and after the failure to stabilize above the upper median line (UML) of the major descending pitchfork. Personally, I believe that only the fundamental factors could turn the rate to the upside again.


