
Short term Elliott wave view in S&P 500 E-mini Futures (ES) suggests the rally from March 5 low is unfolding as a 5 waves impulsive Elliott Wave structure. Up from March 5 low, wave ((i)) ended at 3978.5 and dips in wave ((ii)) ended at 3843.25. Index resumes higher in wave ((iii)) towards 4183.50 and pullback in wave ((iv)) ended at 4110.75.
Internal of wave ((iv)) unfolded as a double zigzag structure. Down from wave ((iii)), wave a ended at 4160.75, wave b ended at 4174.75, and wave c ended at 4141.75. This completed wave (w) of the double zigzag. Bounce in wave (x) ended at 4167.25. Down from there, another zigzag formed where wave a ended at 4131, wave b ended at 4151, and wave c ended at 4109.94. This completed wave (y) of the double zigzag and also wave ((iv)) in higher degree.
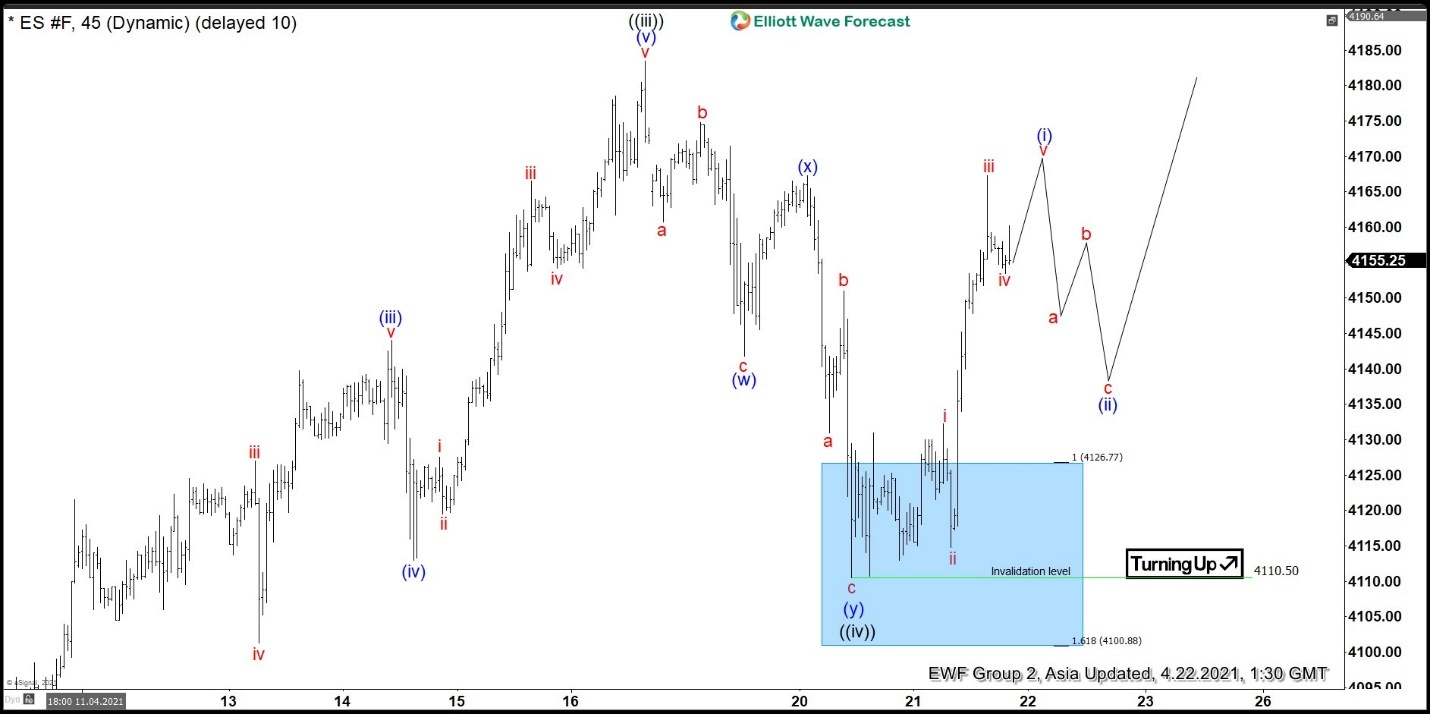
Index completed wave ((iv)) at the blue box where wave (y) = 100% – 161.8% Fibonacci extension of wave (w). The short term rally looks impulsive so far favoring further upside. Up from wave ((iv)), wave i ended at 4132.25 and dips in wave ii ended at 4114.75. Index then resumes higher in wave iii towards 4167.25 and wave iv ended at 4153.5. Expect 1 more push higher to end wave v of (i). Index should then pullback in wave (ii) to correct cycle from April 20 low before the rally resumes. As far as pivot at 4109.94 stays intact, expect dips to find support in 3, 7, or 11 swing for more upside.
S&P 500 E-Mini Futures (ES) 45 Minutes Elliott Wave Chart


