
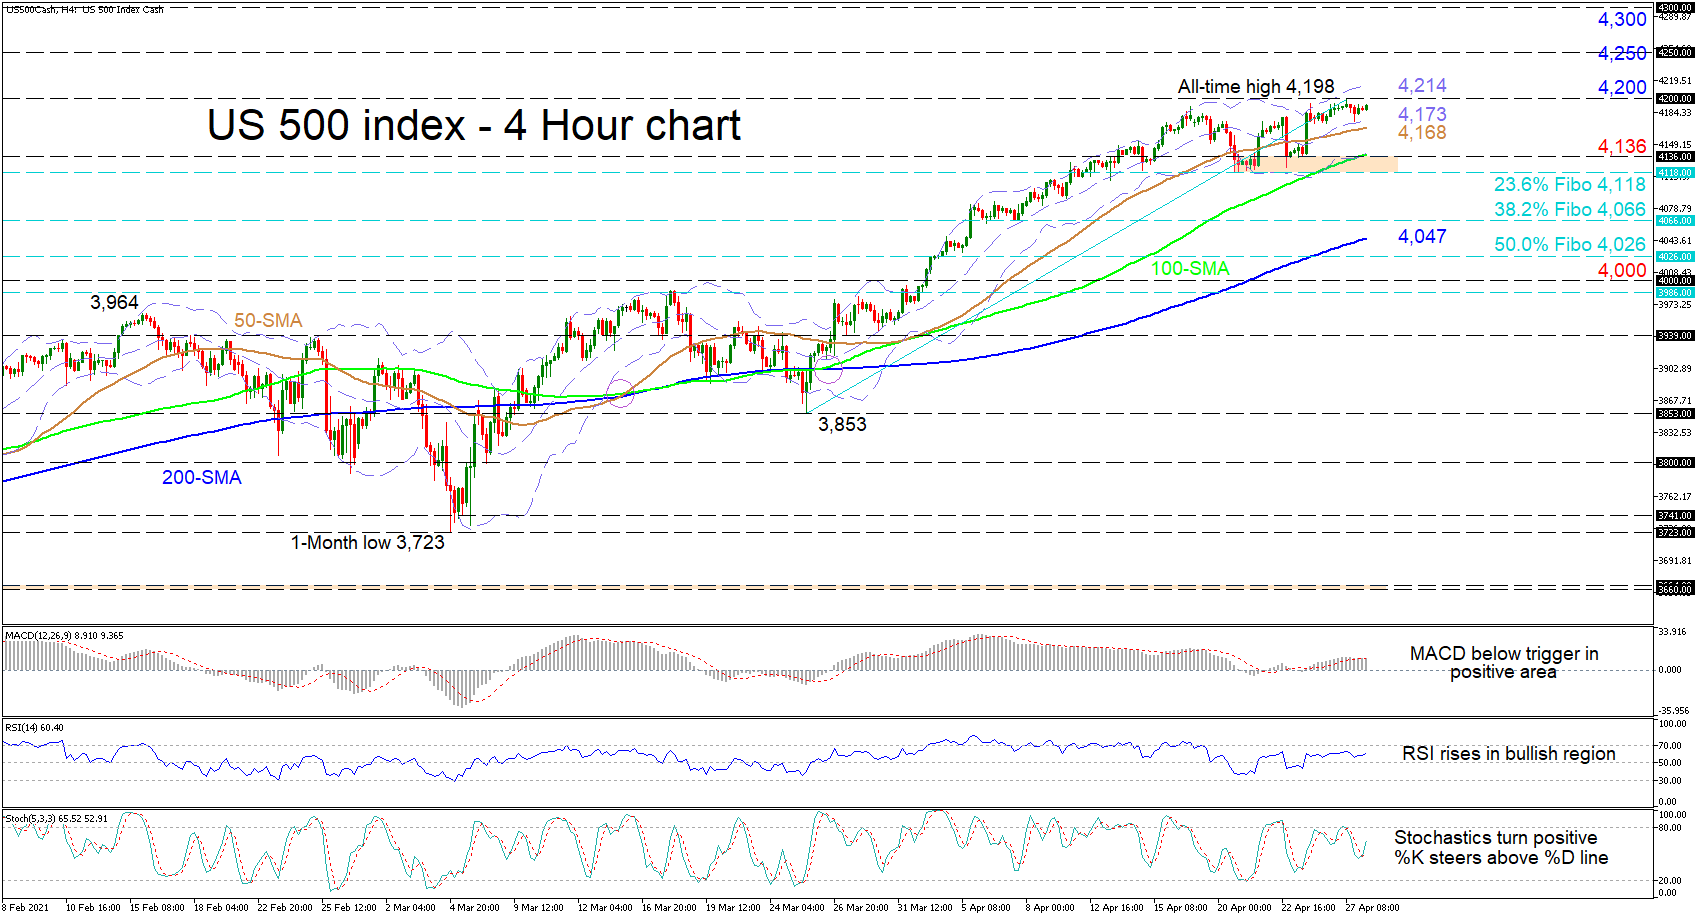
The US 500 stock index (Cash) is consolidating just beneath its fresh all-time high of 4,198 by sustaining some footing off the mid-Bollinger band around 4,173. Positive momentum is present after sellers failed on two occasions to overturn the bullish bias by steering beneath the 50-period simple moving average (SMA). However, currently, the necessary impetus to steer the index higher is frail. The bullish SMAs are defending the ascent, while the short-term oscillators are conveying mixed signals in directional momentum.
The MACD, in the positive region, has slid below its red trigger line, while the RSI is creeping higher in bullish territory. The stochastic oscillator has reclaimed its positive charge and is promoting additional positive price action.
If buying interest increases, resistance may commence directly from the 4,200 hurdle, in the area of the all-time high, ahead of the upper Bollinger band at 4,214. Should an optimistic demeanour prevail in the index, buyers may then target the 4,250 and 4,300 handles.
To the downside, sellers may face early obstructions from the mid-Bollinger band and the 50-period SMA at 4,173 and 4,168, respectively. If the index retreats further, the lower Bollinger band at 4,145 – coupled with the 100-period SMA – may reinforce the adjacent support region of 4,118-4,136, the former being the 23.6% Fibonacci retracement of the up leg from 3,853 until 4,198. Plunging below this base, the price may meet the 38.2% Fibo at 4,066 before the 200-period SMA at 4,047 comes into focus. Losing additional ground, the price may then test the 50.0% Fibo at 4,026.
Overall, the index is sustaining its bullish tone above the SMAs and the support zone of 4,118-4,136. Again, the 4,000 mark remains a key border to shifting the bias.


