
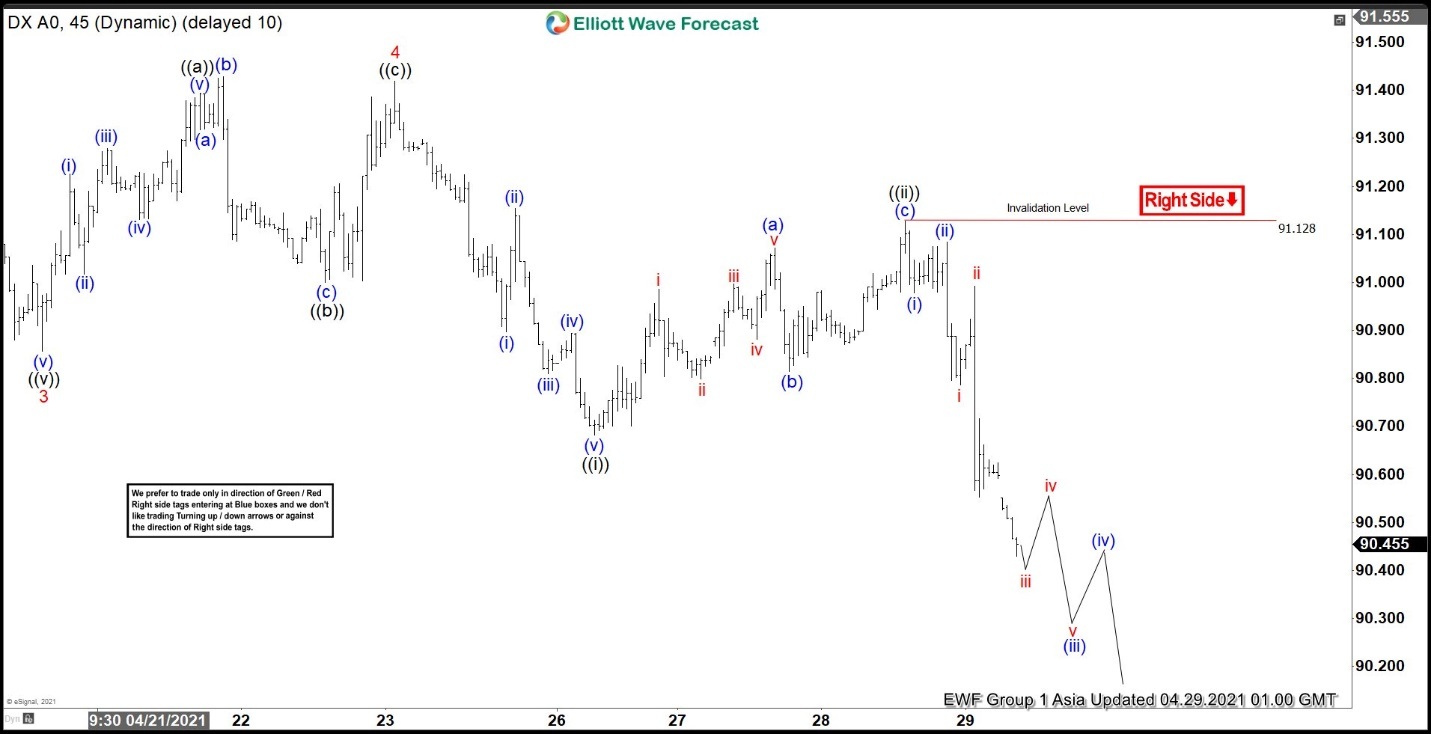
Short term Elliott wave view in Dollar Index (DXY) suggests the decline from March 31, 2021 high is unfolding as a 5 waves impulse Elliott Wave structure. Down from March 31 high, wave 1 ended at 92 and bounce in wave 2 ended at 92.41. The Index then resumed lower and ended wave 3 at 90.85 as the 45 minutes chart below shows. Bounce in wave 4 ended at 91.42 as a zigzag where wave ((a)) ended at 91.4, wave ((b)) ended at 91, and wave ((c)) ended at 91.42.
Wave 5 lower is currently in progress with internal subdivision as a 5 waves impulse in lesser degree. Down from wave 4, wave ((i)) ended at 90.68 and bounce in wave ((ii)) ended at 91.12. Index has resumed lower in wave ((iii)) and should see a few more lows before ending wave ((iii)). Afterwards, it should bounce in wave ((iv)) before turning lower again in wave ((v)). Near term, as far as pivot at 91.128 high stays intact, expect rally to fail in the sequence of 3, 7, or 11 swing for further downside. Short term target for wave ((iii)) is 100% – 161.8% Fibonacci extension of wave ((i)) at 89.9 – 90.4.
Dollar Index (DXY) 45 Minutes Elliott Wave Chart


