
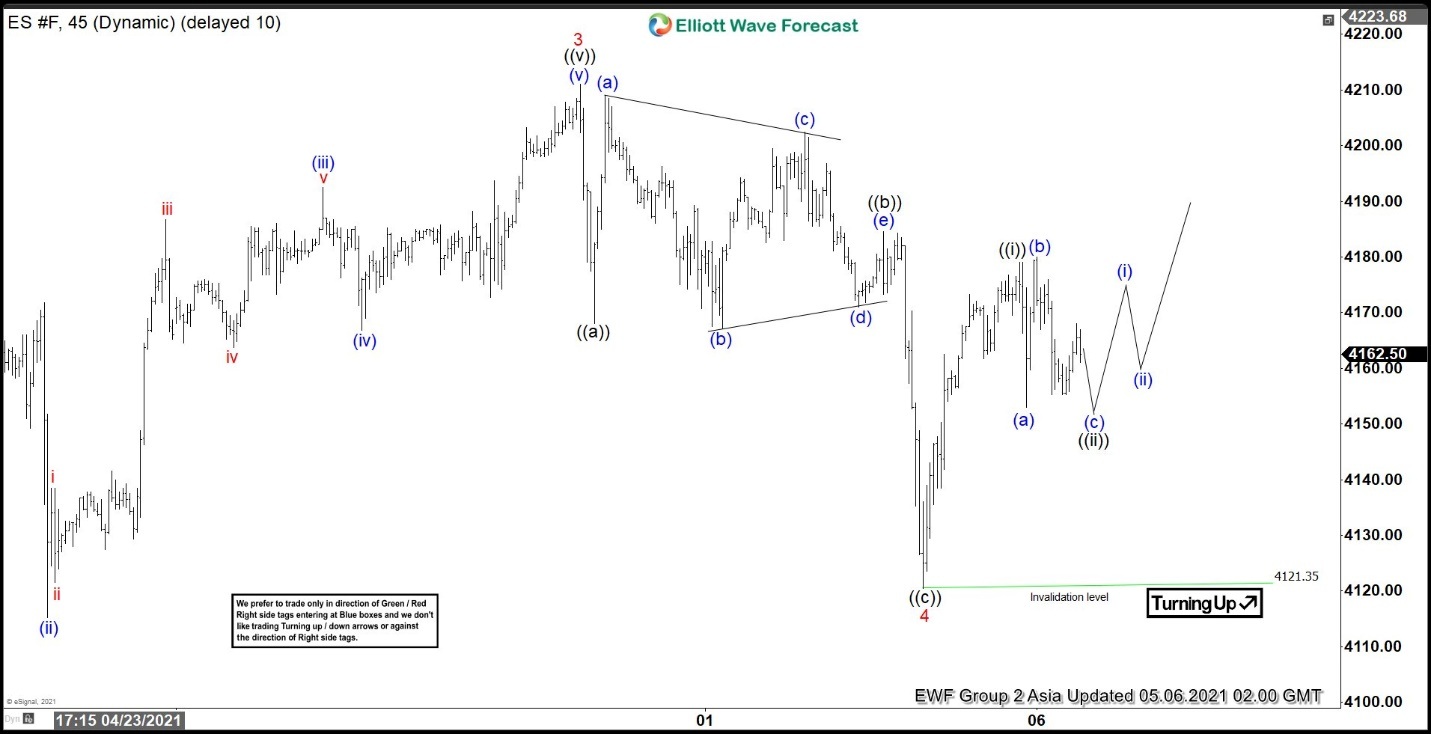
S&P 500 E-Mini Futures (ES) rally from February 1, 2021 low is unfolding as a 5 waves impulse Elliott Wave structure. Up from February 1 low, wave 1 ended at 3959.25 and pullback in wave 2 ended at 3720.5. The Index extends higher in wave 3 towards 4211 as the 45 minutes Elliott Wave chart below shows. Wave 4 pullback is proposed complete at 4120.4. The Index still needs to break above wave 3 at 4211 to avoid a double correction.
Internal of wave 4 unfolded as a zigzag Elliott Wave structure. Down from wave 3, wave ((a)) ended at 4168. Wave ((b)) correction ended at 4184.5 as a running triangle. Wave (a) of the triangle ended at 4209, wave (b) at 4167.25, wave (c) at 4202.5, wave (d) at 4171, and wave (e) of ((b)) ended at 4184.50. Index then resumed lower in wave ((c)) and completed wave 4 at 4120.41. Index has turned higher in wave 5. Up from wave 4, wave ((i)) ended at 4179 and pullback in wave ((ii)) is unfolding as an expanded flat. Near term, as far as pivot at 4120.4 low remains intact, expect dips to find support for further upside.
ES 45 Minutes Elliott Wave Chart

 Interventions?")


