
Elliott Wave View in Nifty suggests the rally from January 29, 2021 low is unfolding as a 5 waves impulsive Elliott Wave structure. Up from January 29 low, wave 1 ended at 15431.75 and pullback in wave 2 ended at 14151.40. Index resumes higher in wave 3 towards 15901.60 and dips in wave 4 ended at 15450.90. Index has resumed higher in wave 5 with internal subdivision as another 5 waves in lesser degree.
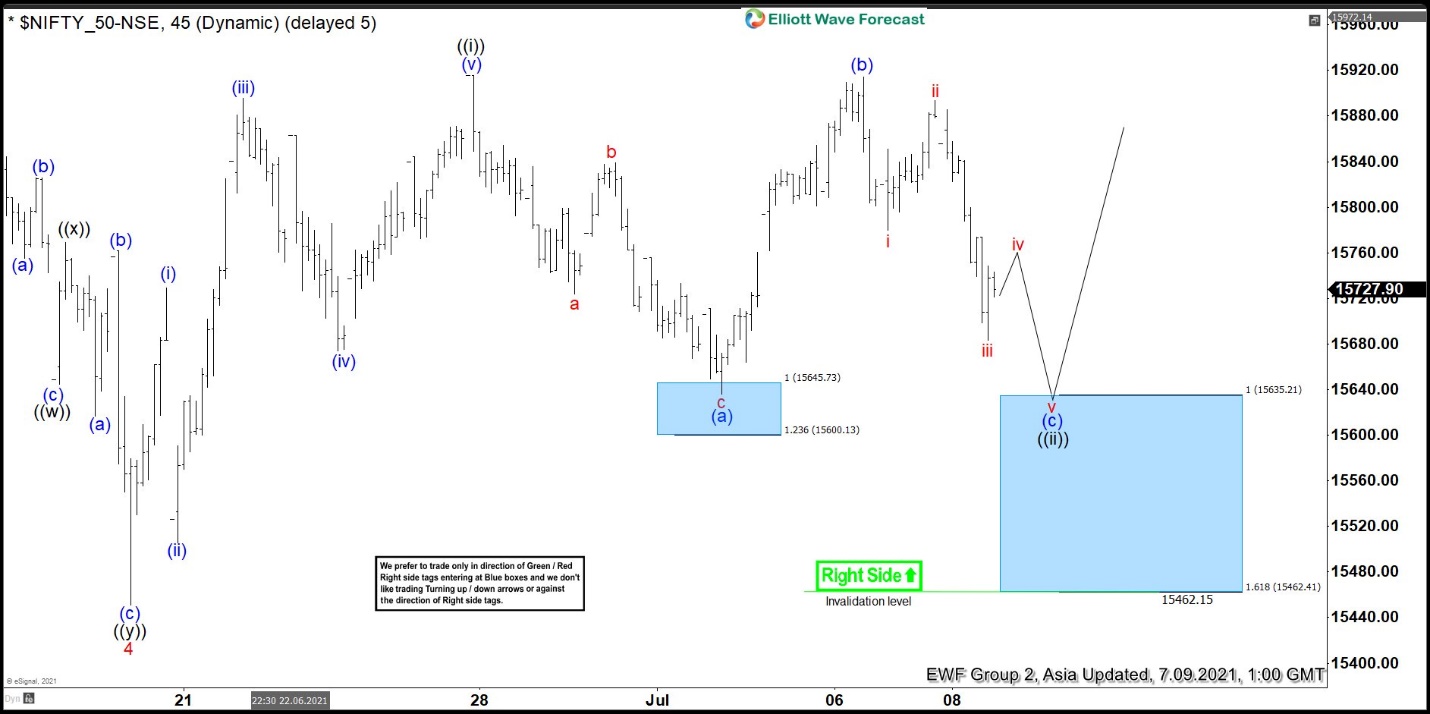
Up from wave 4, wave (i) ended at 15729.20 and pullback in wave (ii) ended at 15505.65. Index resumes higher in wave (iii) to 15895.75 and dips in wave (iv) ends at 15673.95. Final leg higher wave (v) ended at 15915.65. This completed wave ((i)) in higher degree. Wave ((ii)) pullback is unfolding as a Flat Elliott Wave structure. Down from wave ((i)), wave (a) ended at 15635.95, and rally in wave (b) ended at 15914.20. Wave (c) is expected to complete at 100% – 161.8% Fibonacci extension of wave (a) at 15462.15 – 15635.21 blue box area. From this area, buyers should appear for the next leg higher or at least 3 waves rally.
Nifty 45 Minutes Elliott Wave Chart


