
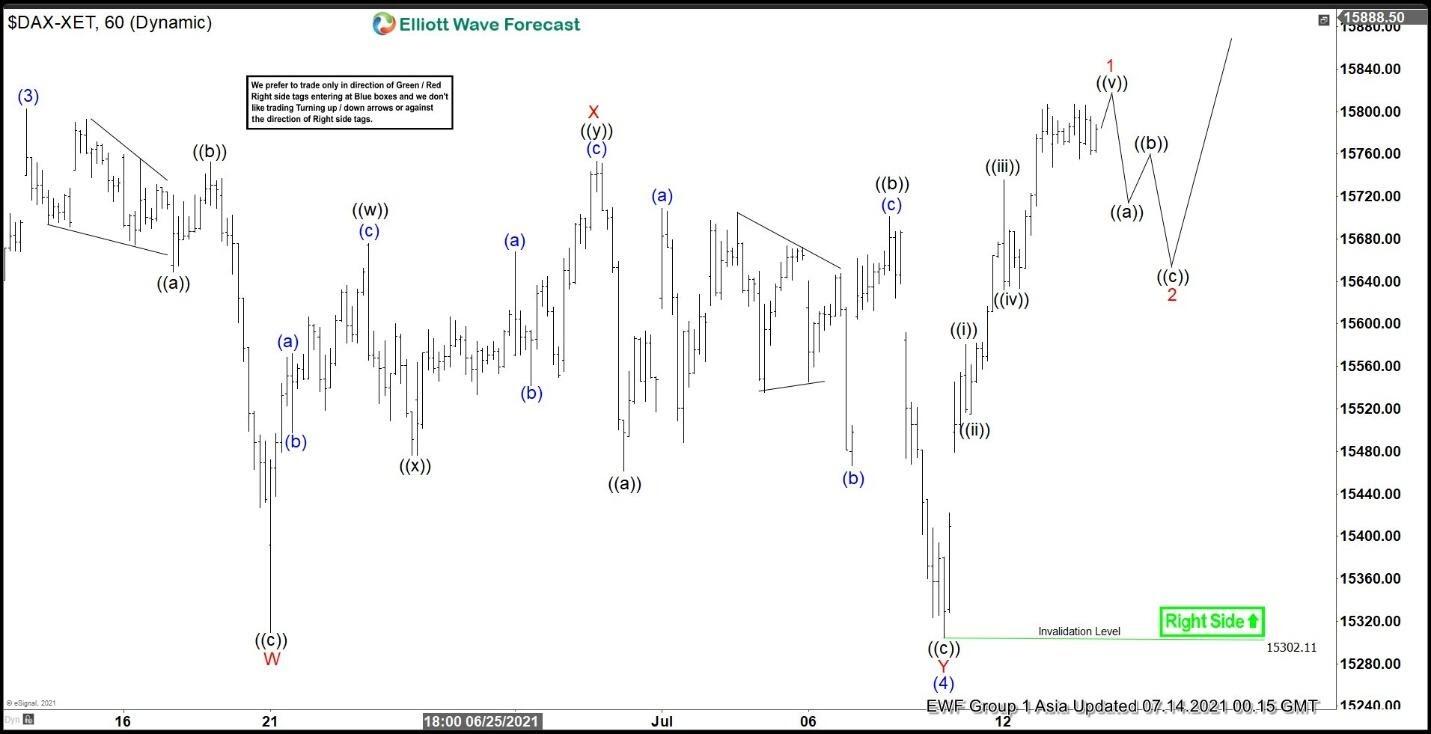
Rally in DAX from November 2, 2020 low is unfolding as a 5 waves impulse Elliott Wave structure. In the 60 minutes chart below, wave (3) of this rally can be seen to have ended at 15802.67 and pullback in wave (4) ended at 15304.41. Internal of wave (4) unfolded as a double three Elliott Wave structure. Down from wave (3), wave ((a)) ended at 15649.22 and rally in wave ((b)) ended at 15752.34. Last leg lower wave ((c)) ended at 15309.44 and this completed wave W in higher degree. Bounce in wave X took form of a double three structure. Up from wave W, wave ((w)) ended at 15675.90, wave ((x)) ended at 15476.11, and wave ((x)) ended at 15752.93. This completed wave X in higher degree.
Index then resumed lower in wave Y as a zigzag structure. Down from wave X, wave ((a)) ended at 15461.2 and rally in wave ((b)) ended at 15700.95. Last leg lower wave ((c)) ended at 15302.11 and this completed wave Y of (4) in higher degree. Index has resumed higher and broken above previous wave (3) peak at 15802.67 on June 14 high. Up from wave (4), wave ((i)) ended at 15580.81 and pullback in wave ((ii)) ended at 15515.12. Index rallied in wave ((iii)) towards 15735.63, and pullback in wave ((iv)) ended at 15631.84. Final leg higher wave ((v)) of 1 should end soon. Index should then pullback in wave 2 to correct cycle from July 8 low before the rally resumes. As far as July 8 low pivot at 15302.11 stays intact, expect dips to find support in 3, 7, or 11 swing for more upside.
DAX 60 Minutes Elliott Wave Chart


