
Technical analysis
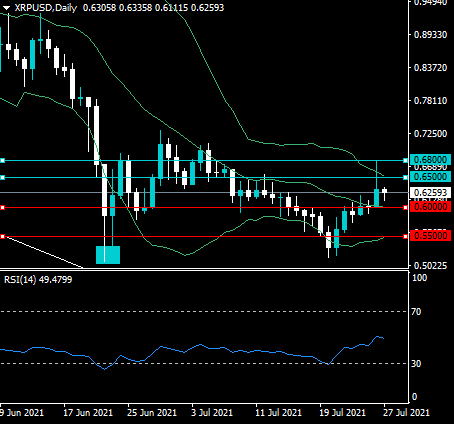
The XRPUSD pair has tested its upper daily Bollinger Band indicator and suffered a big rejection. The daily Bollinger Bands are narrowing, which indicates a breakout could be coming.
The daily time frame shows that the RSI indicator has not turned bullish yet and remains under 50. Bulls may have also reached the possible upside weekly target of 0.6800, meaning the chances of correcting even lower is therefore high.
What the possible outcomes are
In our most likely scenario, the XRPUSD pair will fall break under the mid-line of the daily Bollinger Band, around descend towards the lower daily Bollinger Band, close to the 0.5700 support area.
Alternatively, the XRPUSD pair may start to test back towards the current weekly high but will not break it, and then fall back towards the 0.5700 support level.
Key levels
Support $0.6000 $0.5500
Resistance $0.6500 $0.6800


