
The EUR/USD currency pair
Technical indicators of the currency pair:
Prev Open: 1.1555
Prev Close: 1.1553
% chg. over the last day: -0.02%
The European Central Bank has left monetary policy unchanged. The ECB will consider policy alternatives in December. Germany’s industrial production experienced its highest drop in August since last April due to supply chain problems, which constrained the growth of Europe’s largest economy and hit the automotive sector.
Trading recommendations
Support levels: 1.1502, 1.1453
Resistance levels: 1.1583, 1.1671, 1.1717, 1.1772, 1.1802, 1.1835
From the technical point of view, the EUR/USD trend is bearish. But the MACD indicator shows divergence on the higher timeframes. Under such market conditions, traders should consider sell deals from the resistance levels near the moving average, as the price has deviated from the middle line. Buy trades should be considered only from the support levels with additional confirmation in the form of a buyers’ initiative.
Alternative scenario: if the price breaks out through the 1.1717 resistance level and fixes above, the mid-term uptrend will likely resume.

News feed for 2021.10.08:
- US Nonfarm Payrolls (m/m) at 15:30 (GMT+3);
- US Unemployment Rate (m/m) at 15:30 (GMT+3).
The GBP/USD currency pair
Technical indicators of the currency pair:
Prev Open: 1.3582
Prev Close: 1.3612
% chg. over the last day: +0.22%
Despite the decline in natural gas prices, gas prices in the UK are still seven times higher than usual. It costs the industry huge bills and pushes domestic consumers to the brink of ruin. The National Grid is warning of electricity supply restrictions this winter.
Trading recommendations
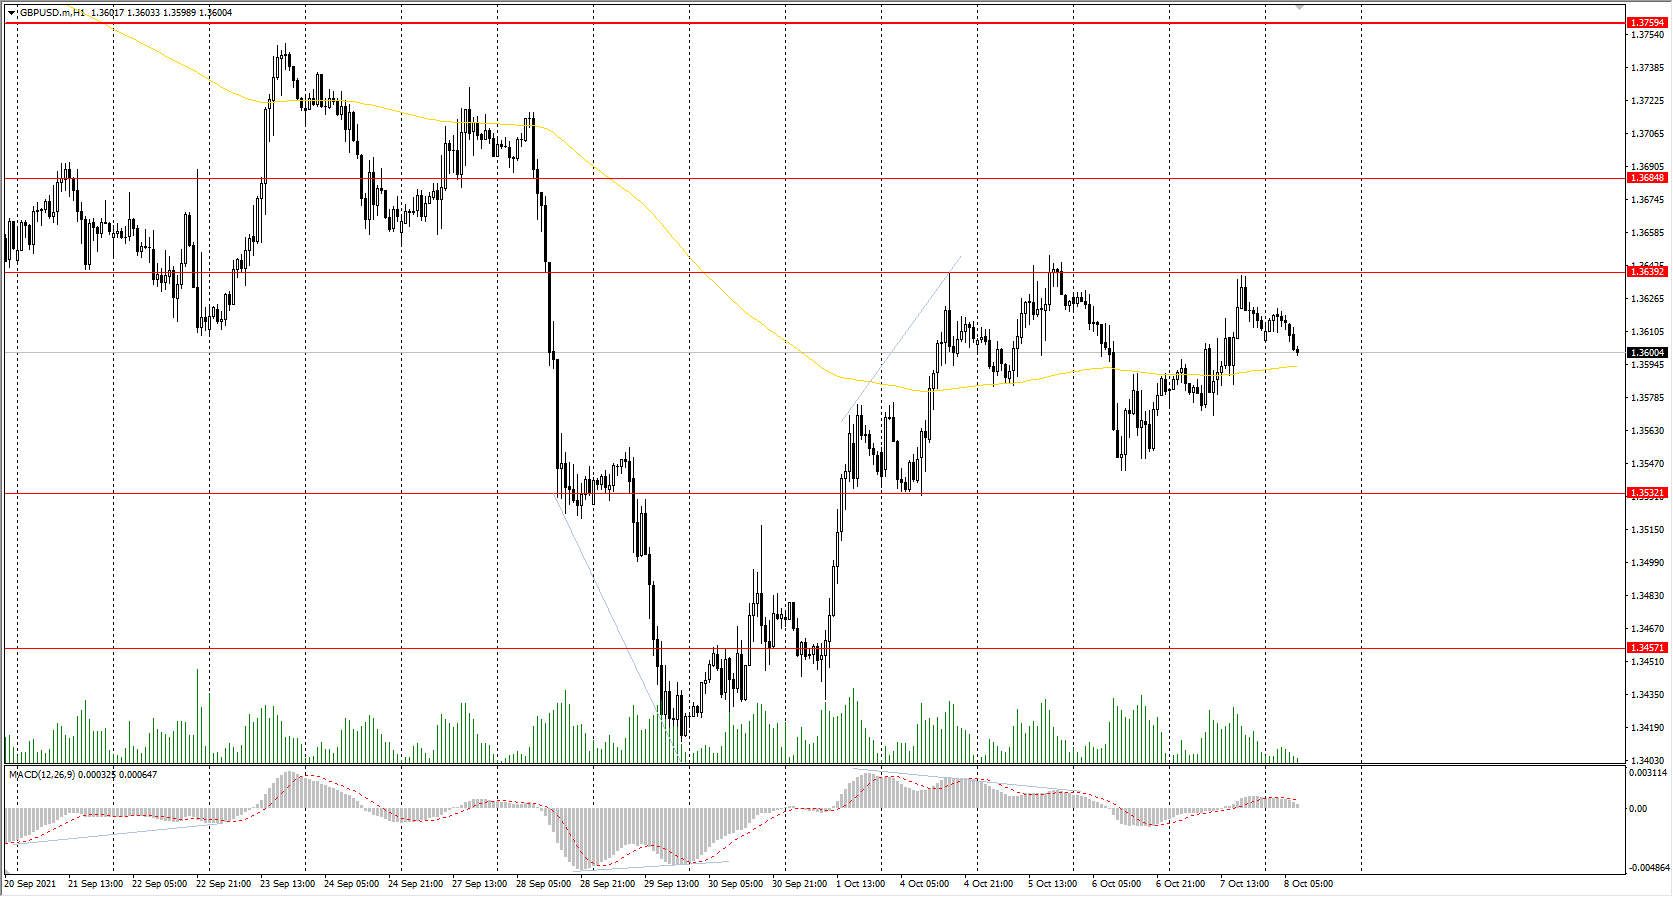
Support levels: 1.3532, 1.3457, 1.3360, 1.3282
Resistance levels: 1.3639, 1.3685, 1.3759, 1.3812, 1.3886
On the hourly time frame, the GBP/USD trend is bearish. The British currency looks more confident than the euro due to a direct correlation with oil prices. The MACD indicator has become inactive. Buy trades should be considered only throughout the day and only with short targets from the support levels after the buyer’s initiative. Sell trades can be found at the resistance levels near the moving average line.
Alternative scenario: if the price breaks out through the 1.3759 resistance level and consolidates above, the bullish scenario will likely resume.
News feed for 2021.10.08:
- US Nonfarm Payrolls (m/m) at 15:30 (GMT+3).
The USD/JPY currency pair
Technical indicators of the currency pair:
Prev Open: 111.38
Prev Close: 111.61
% chg. over the last day: +0.21%
Japan’s new Prime Minister, Fumio Kishida, will outline his political program today. According to preliminary data, the main points of the program will be the increase of the capital gains tax from 20% to 25%, as well as the need to inject more than 30 trillion yen ($269 billion) of budget expenses to combat the consequences of the coronavirus pandemic.
Trading recommendations
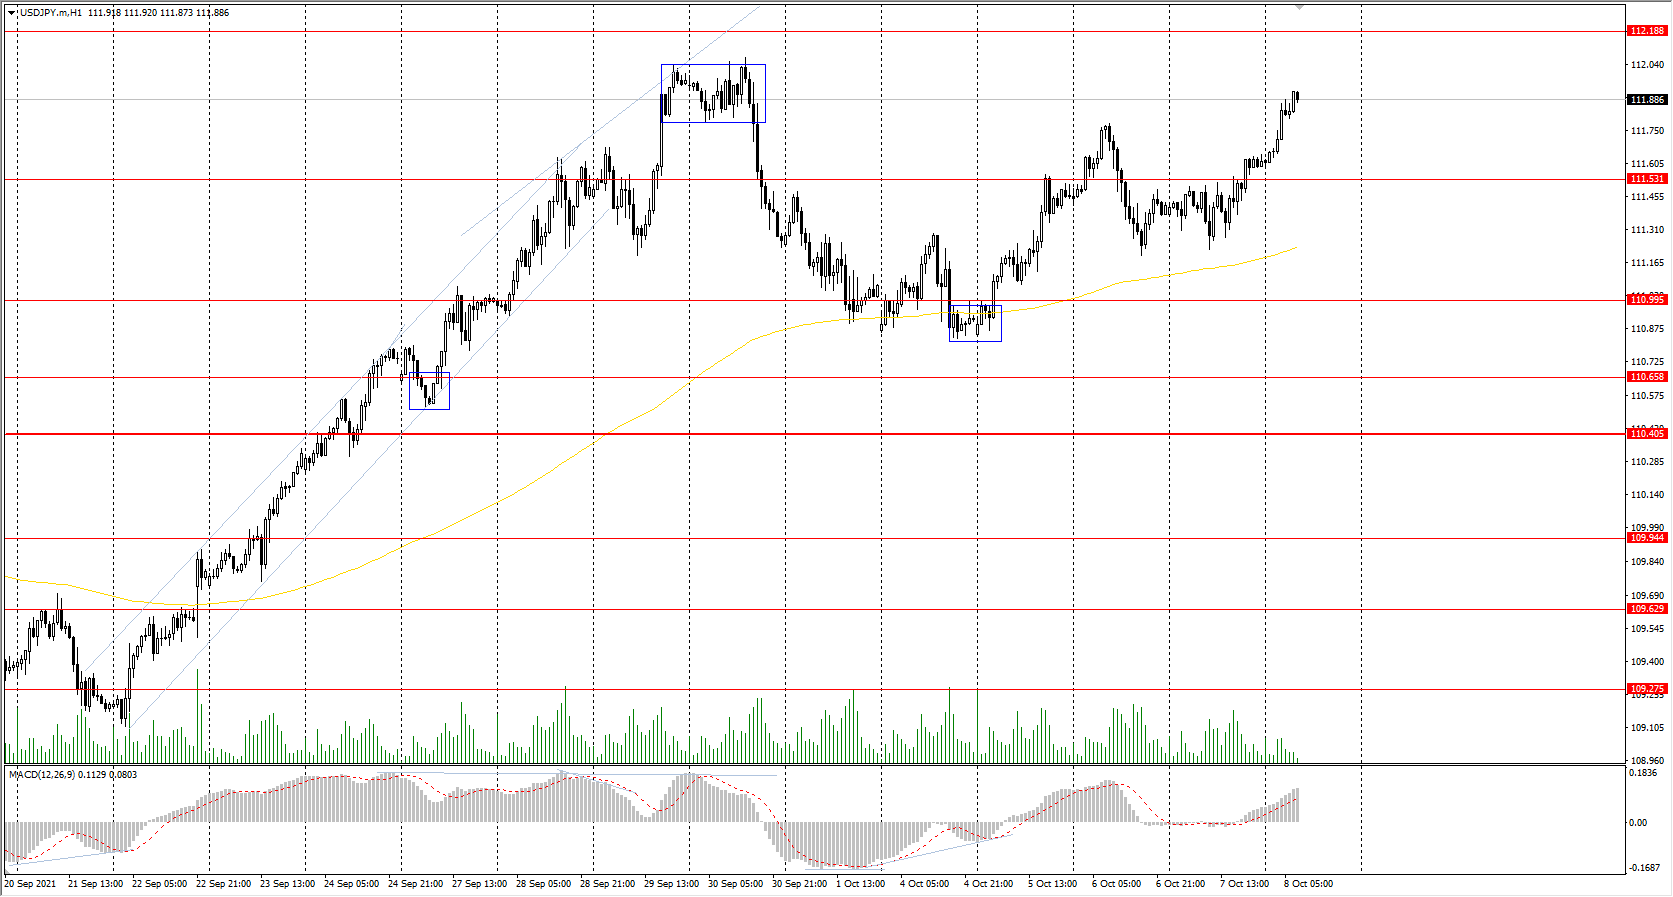
Support levels: 111.53, 110.99, 110.65, 110.40, 109.95, 109.63, 109.27
Resistance levels: 112.19
The main trend of the USD/JPY currency pair is bullish. The MACD indicator has become positive again, but there are the first signs of divergence. Under such market conditions, it’s better to look for buy positions from the support levels near the moving average. Sell positions should be considered only throughout the day from the resistance levels, given there is sellers’ initiative.
Alternative scenario: if the price falls below 110.45, the uptrend is likely to be broken.
News feed for 2021.10.08:
- US Nonfarm Payrolls (m/m) at 15:30 (GMT+3).
- The USD/CAD currency pair
Technical indicators of the currency pair:
Prev Open: 1.2588
Prev Close: 1.2551
% chg. over the last day: -0.29%
The Canadian dollar is a commodity currency, so USD/CAD is highly dependent on the dynamics of the dollar index and oil prices. The dollar index hardly changed yesterday, while oil prices increased. As a result, the USD/CAD quotes continued to decline. Bank of Canada Governor Tiff Macklem says that Canada’s high inflation rate is largely due to the circumstances of the Covid-19 pandemic, and Canada’s annual inflation rate is likely to remain above the central bank’s target range of 1% to 3% for the rest of this year.
Trading recommendations
Support levels: 1.2518, 1.2425
Resistance levels: 1.2565, 1.2611, 1.2729, 1.2774, 1.2891
From the technical point of view, the trend of the USD/CAD currency pair is bearish. But the MACD indicator is showing the divergence on several timeframes. There is also a liquidity narrowing, which is a common signal of the start of a sharp impulse. The report on the labor market in the US and Canada might be a trigger for the beginning of this impulsive move. Under such market conditions, it is better to look for sell deals from the resistance levels near the moving average. Buy deals should be considered if the price returns above the 1.2565 level, given there is a buyers’ initiative.
Alternative scenario: if the price breaks out through the 1.2774 resistance level and fixes above, the uptrend will likely resume.

News feed for 2021.10.08:
- US Nonfarm Payrolls (m/m) at 15:30 (GMT+3);
- Canada Unemployment Rate (m/m) at 15:30 (GMT+3).


