
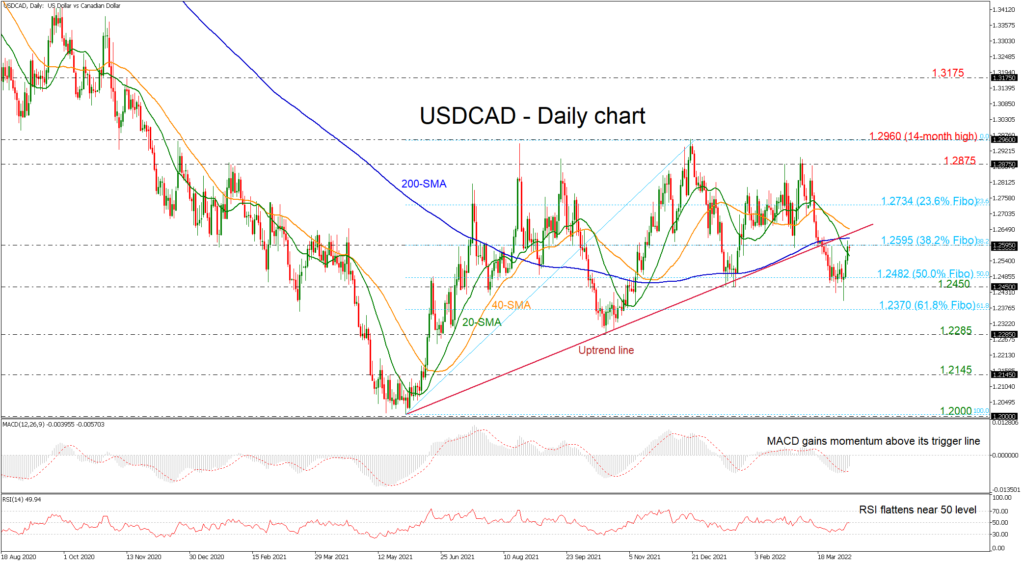
USDCAD created an impressive bullish rally after the rebound off the 50.0% Fibonacci retracement level of the up leg from 1.2000 to 1.2960 at 1.2485 and is now struggling to surpass the 38.2% Fibonacci of 1.2595 and the 200-day simple moving average (SMA). The RSI indicator is moving sideways at the moment around the neutral threshold of 50, while the MACD is heading north above its trigger line.
In case the pair changes its short-term direction to the upside, the bulls will probably challenge the 200-day SMA at 1.2620 and the broken uptrend line. A break higher could last until the 23.6% Fibonacci of 1.2734 before meeting the 1.2875 resistance level.
Alternatively, any declines may drive the price towards the 50.0% Fibonacci of 1.2482 before the 1.2450 support comes into view. Beneath the latter, the 61.8% Fibonacci of 1.2370 could be another level in focus which, if penetrated, would endorse the bearish outlook.
Turning to the medium-term picture, the pair switched to a negative mode after the drop below the ascending trendline. However, in the short-term view, the pair is showing some improvement and may return to positive movements again.


