
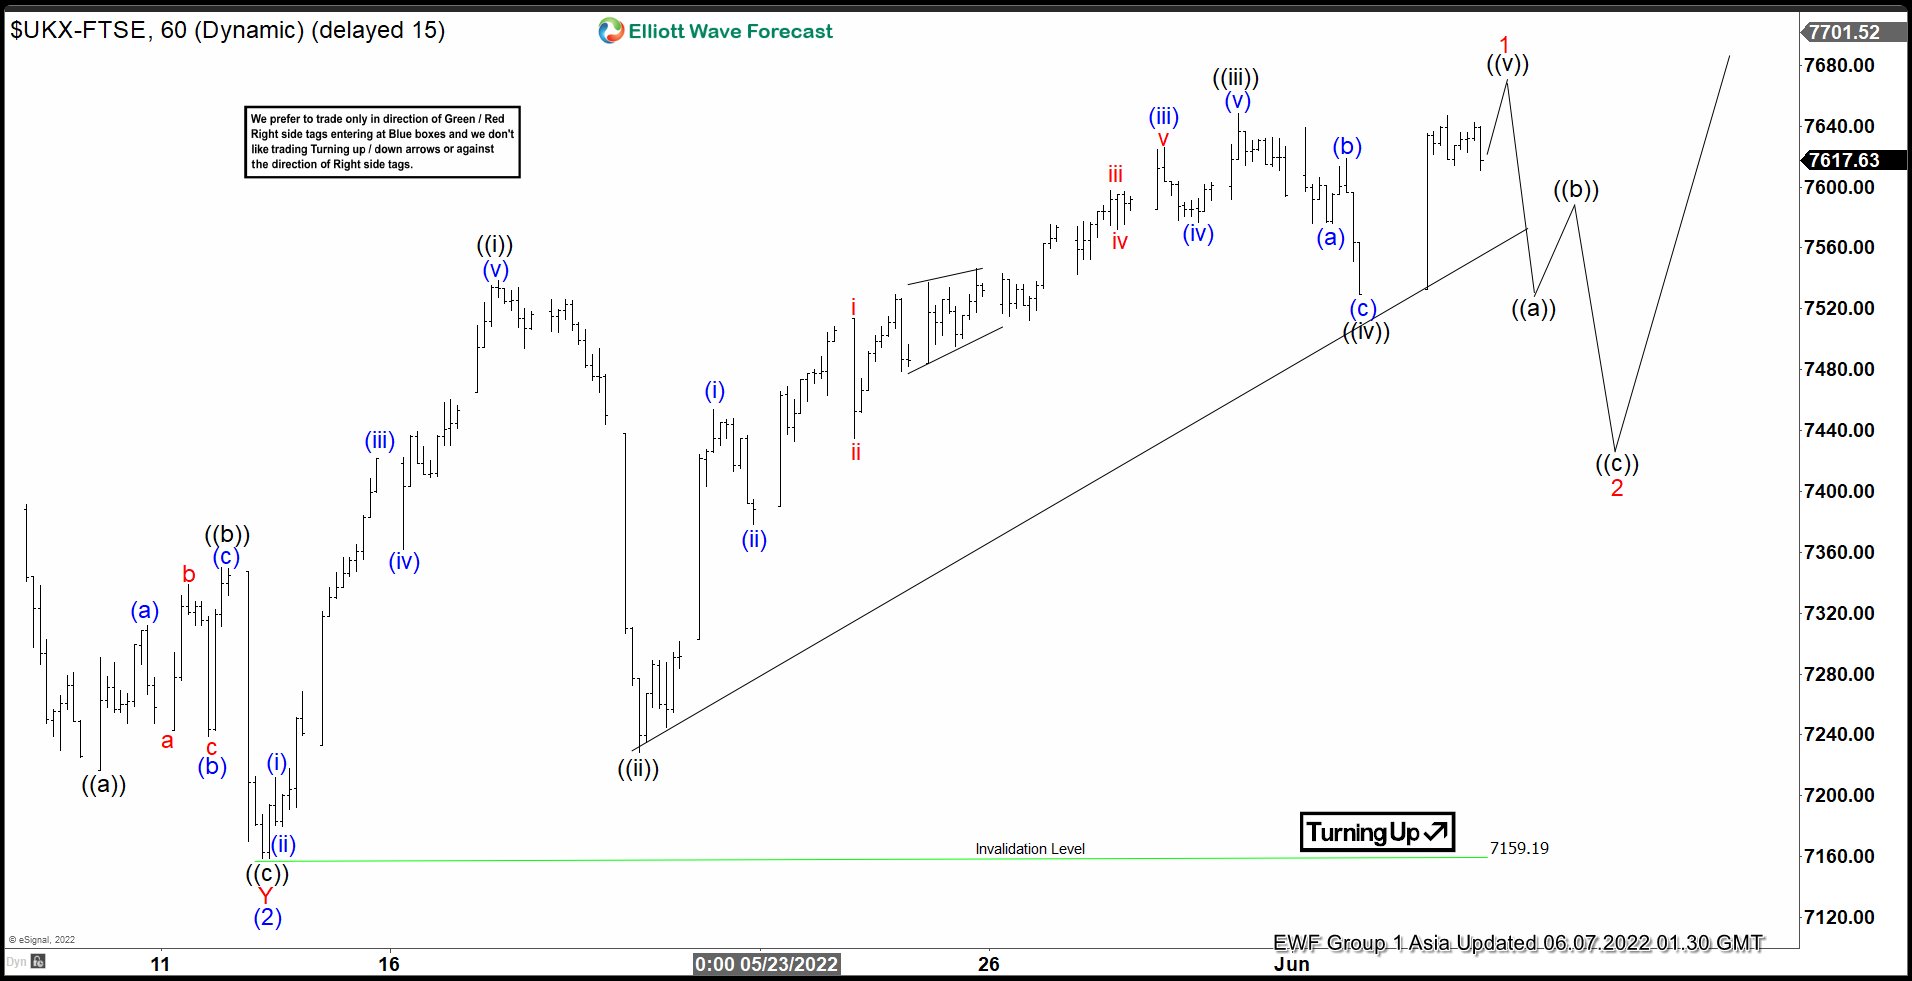
Short Term Elliott Wave View in FTSE suggests rally from 3/7/2022 low is unfolding as a 5 waves impulse Elliott Wave structure. Up from 3/7 low, wave (1) ended at 7669.56 and pullback in wave (2) ended at 7159.19. Internal subdivision of wave (2) unfolded as a double three where wave W ended at 7339.53, wave X ended at 7619.39, and wave Y ended at 7158.53 which completed wave (2). Up from there, wave (3) is currently in progress as another impulsive 5 waves in lesser degree. Index still needs to break above previous peak wave (1) at 7669.56 to confirm the next leg higher has started.
Up from wave (2) low, wave ((i)) ended at 7538.68 and pullback in wave ((ii)) ended at 7228.67. Index then resumes higher in wave ((iii)) towards 7648.26, and dips in wave ((iv)) ended at 7529.23. Expect the Index to soon complete wave ((v)) higher which should end wave 1 in higher degree. Then it should pullback in wave 2 to correct cycle from 5/12/2022 low (7159.19) in 3, 7, or 11 swing before the rally resumes. Once the Index breaks above wave (1) at 7669.56, it should open up a bullish sequence from 3/7/2022 low with a 100% – 161.8% Fibonacci extension target of 8039 – 8582.
FTSE 60 Minutes Elliott Wave Chart


