
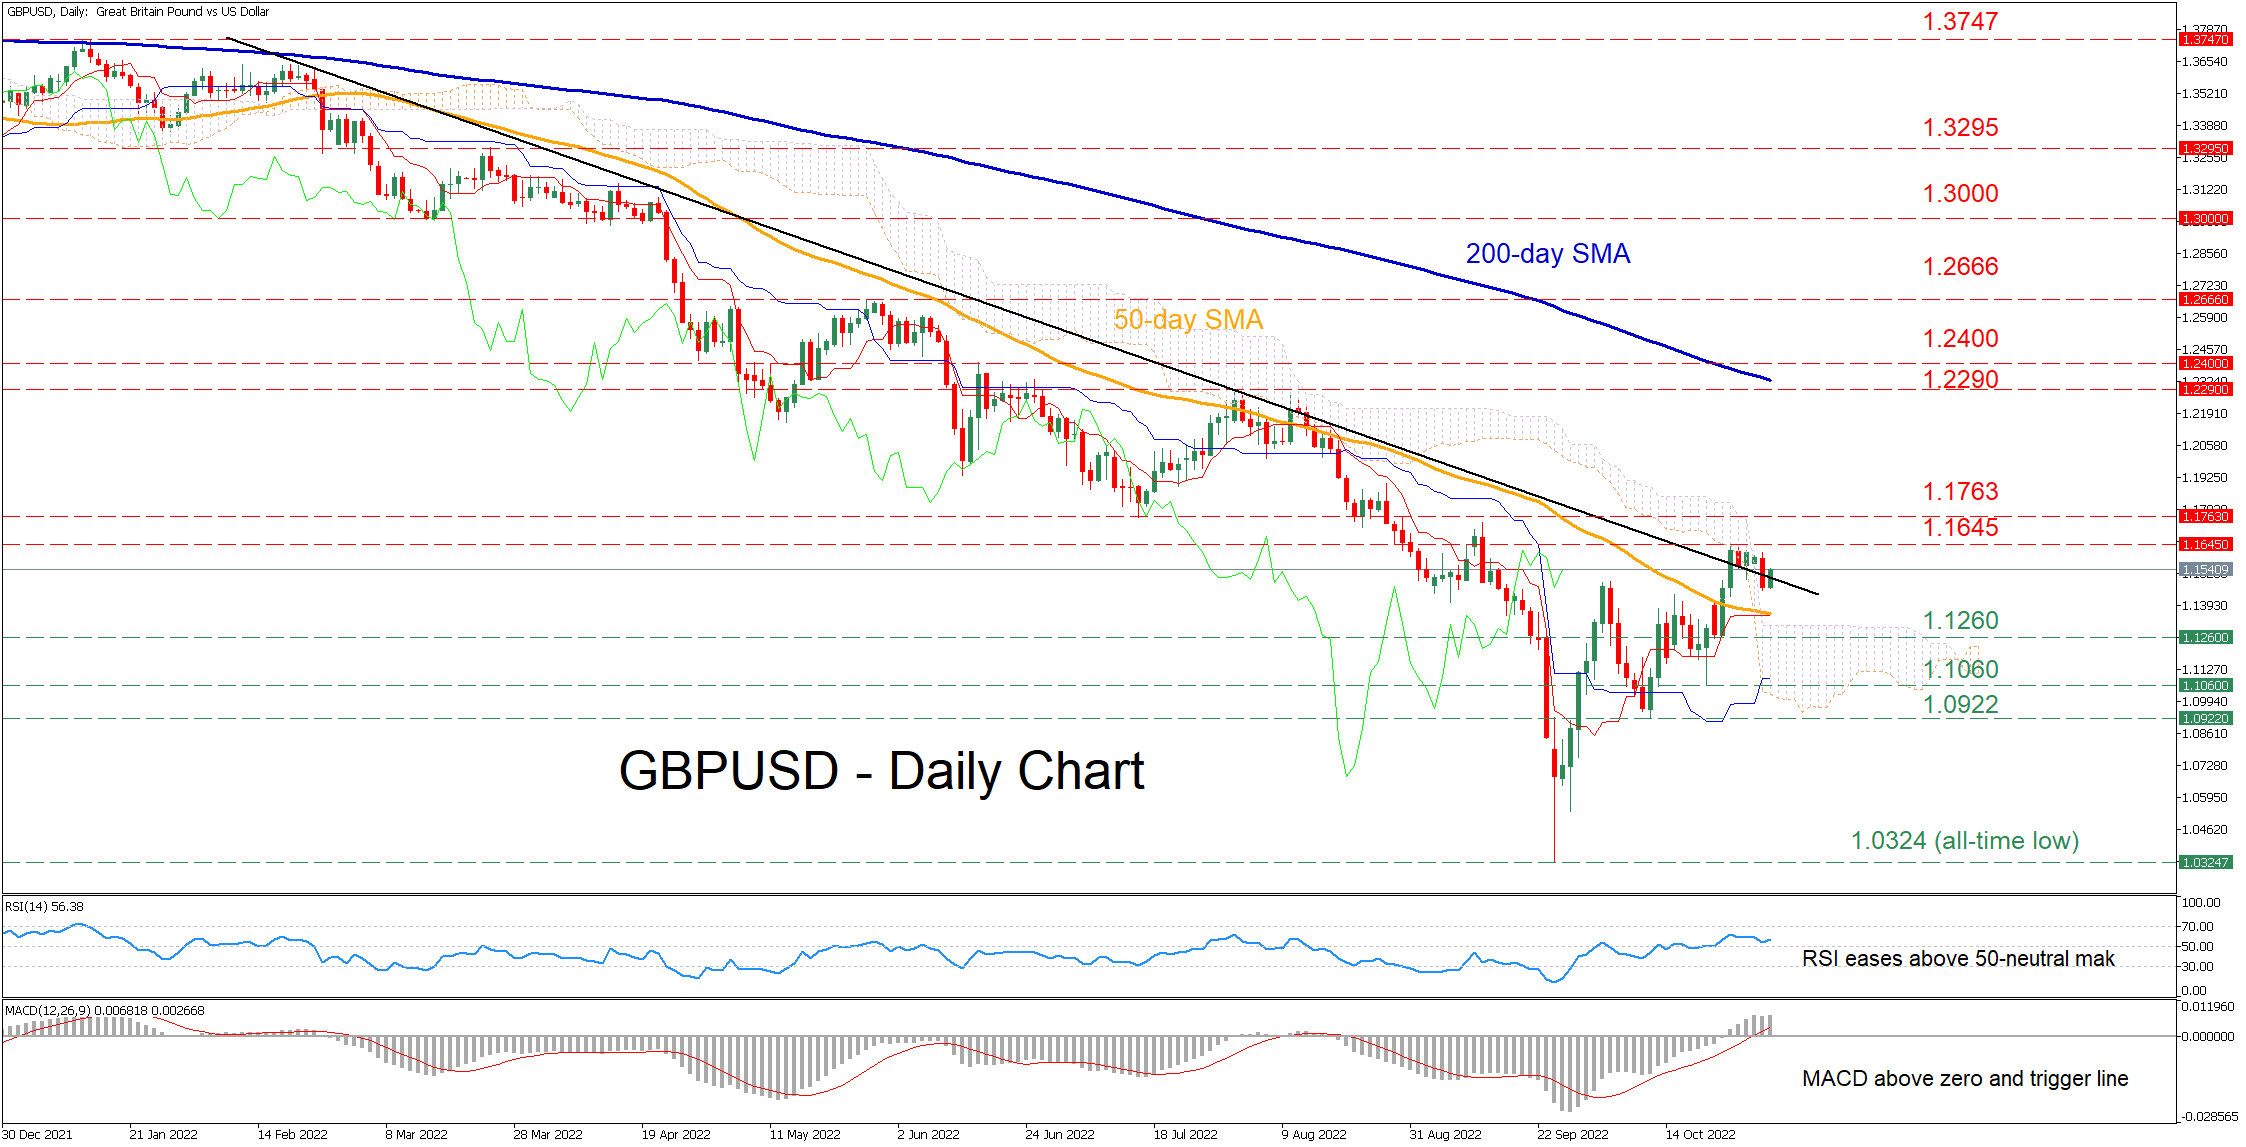
GBPUSD has been in a prolonged downtrend since the beginning of the year, plummeting to an all-time low of 1.0324 in mid-September. Although the pair has been in a recovery mode since then and lately crossed above its descending trendline, its latest advance failed to strengthen further, with the pair retracing back to its bearish pattern.
The short-term oscillators are currently indicating a cautiously bullish near-term tone. Specifically, the RSI is hovering slightly above its 50-neutral mark, while the MACD histogram is softening above both zero and its red signal line.
To the upside, bullish actions could propel the price towards the recent resistance of 1.1645. Piercing through this region, the price could challenge the June support of 1.1763, which could now act as resistance. Even higher, the July peak of 1.2290 could curb any further advances before 1.2400 comes under examination.
Alternatively, should the positive momentum fade and the price reverse downwards, initial support could be met at 1.1260. Sliding beneath that floor, the bears might target 1.1060 before the spotlight turns to the October low of 1.0922. A violation of the latter could open the door for the all-time low of 1.0324.
Overall, GBPUSD appears to be losing steam after managing to break above its long-term restrictive trendline. Therefore, if the price falls again below the latter, the pair will most likely extend its downtrend, while a bounce to the upside could increase bulls’ bets for a sustained rebound.


