
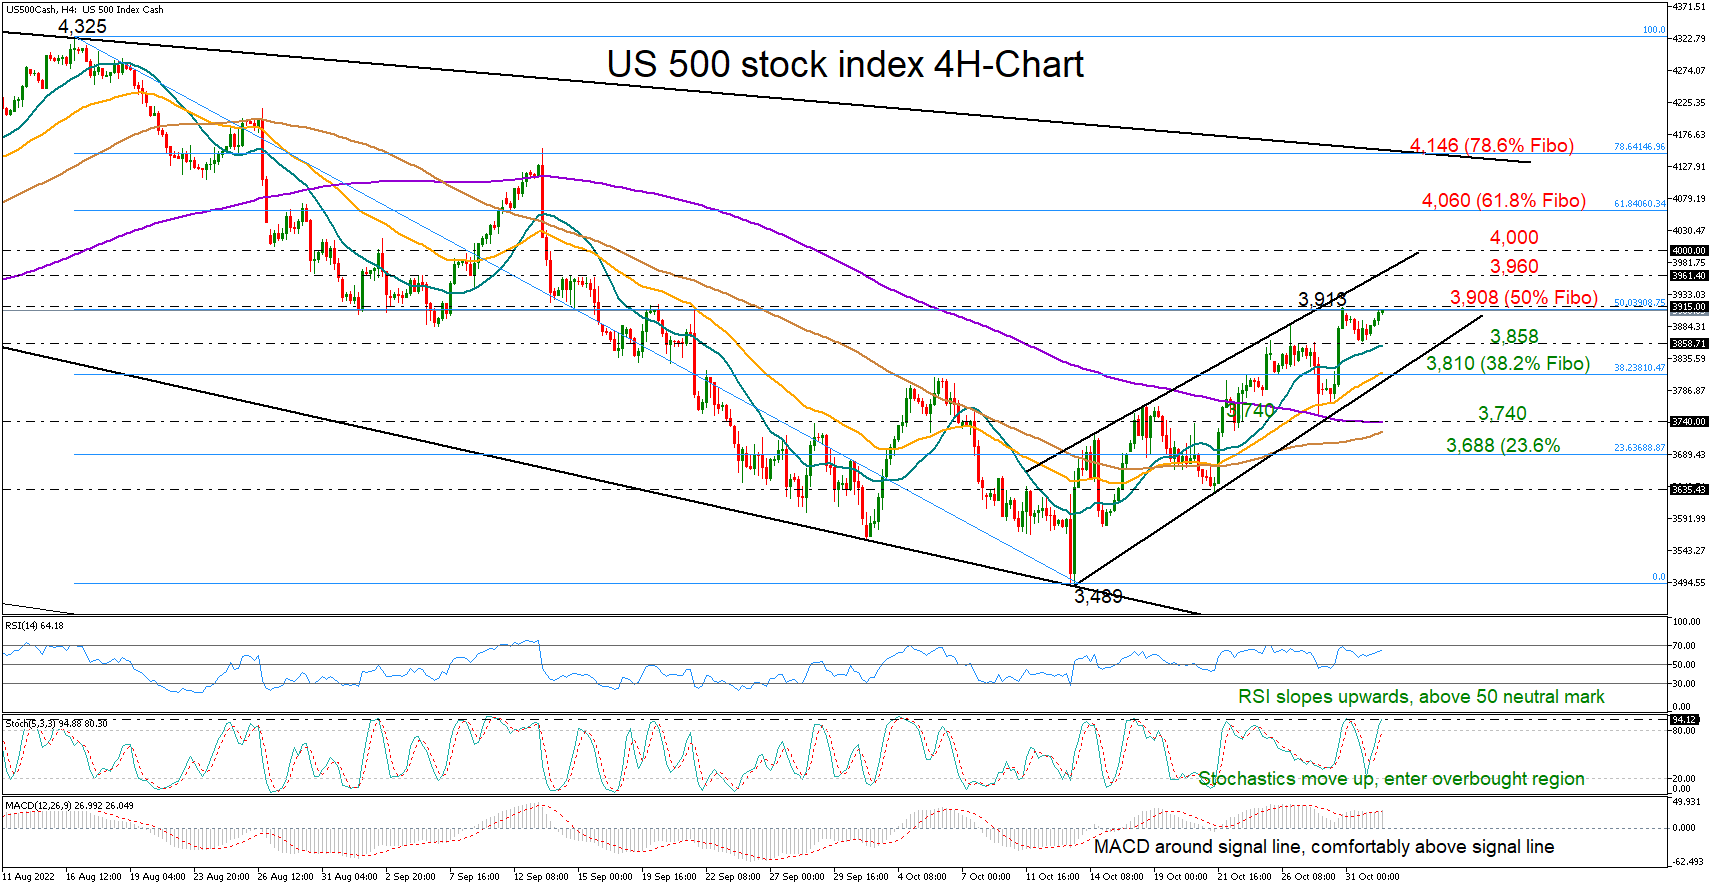
The US 500 stock index (cash) has been building a pattern of higher highs and higher lows since its 2021 downtrend stalled at an almost two-year low of 3,489 in mid-October.
With the price trading above its simple moving averages (SMAs) on the four-hour chart and the momentum indicators fluctuating within the bullish territory, buying interest could persist in the short term.
October’s high of 3,913, which coincides with the 50% Fibonacci retracement of the 4,325-3,489 downleg, is currently under examination. The bulls will need to crawl above it to gain access to the key resistance line around 3,960. The 4,000 round level could be the next barrier, while higher, the bulls may target the 61.8% Fibonacci of 4,060.
Moving to the downside, the index could take some rest around the resistance-turned-support region of 3,858 before heading for the 38.2% Fibonacci of 3,810. The protective 50-period SMA and the key ascending trendline drawn from the 3,489 low could cement that floor, preventing a depreciation towards the 200-period SMA at 3,740.
All in all, the US 500 index is eyeing another bullish breakout, with traders waiting for a confirmation above the 3,913 resistance.


